






A household electricity backup budget in Nigeria needs evidence from the home, not a conversion of national generation into local supply hours. Record the services you could actually use, your backup runtime and the money paid. National grid figures provide context, but they cannot fill in that diary.
NERC’s October 2026 operational release, published 11 November, reports average available generation capacity of 4744 MW and average hourly generation of 4047 MW. Dividing the displayed values gives 85.31%, close to its reported 85% utilisation. That percentage does not mean a household received electricity for 85% of the month.
Household electricity backup budget Nigeria: start with scope
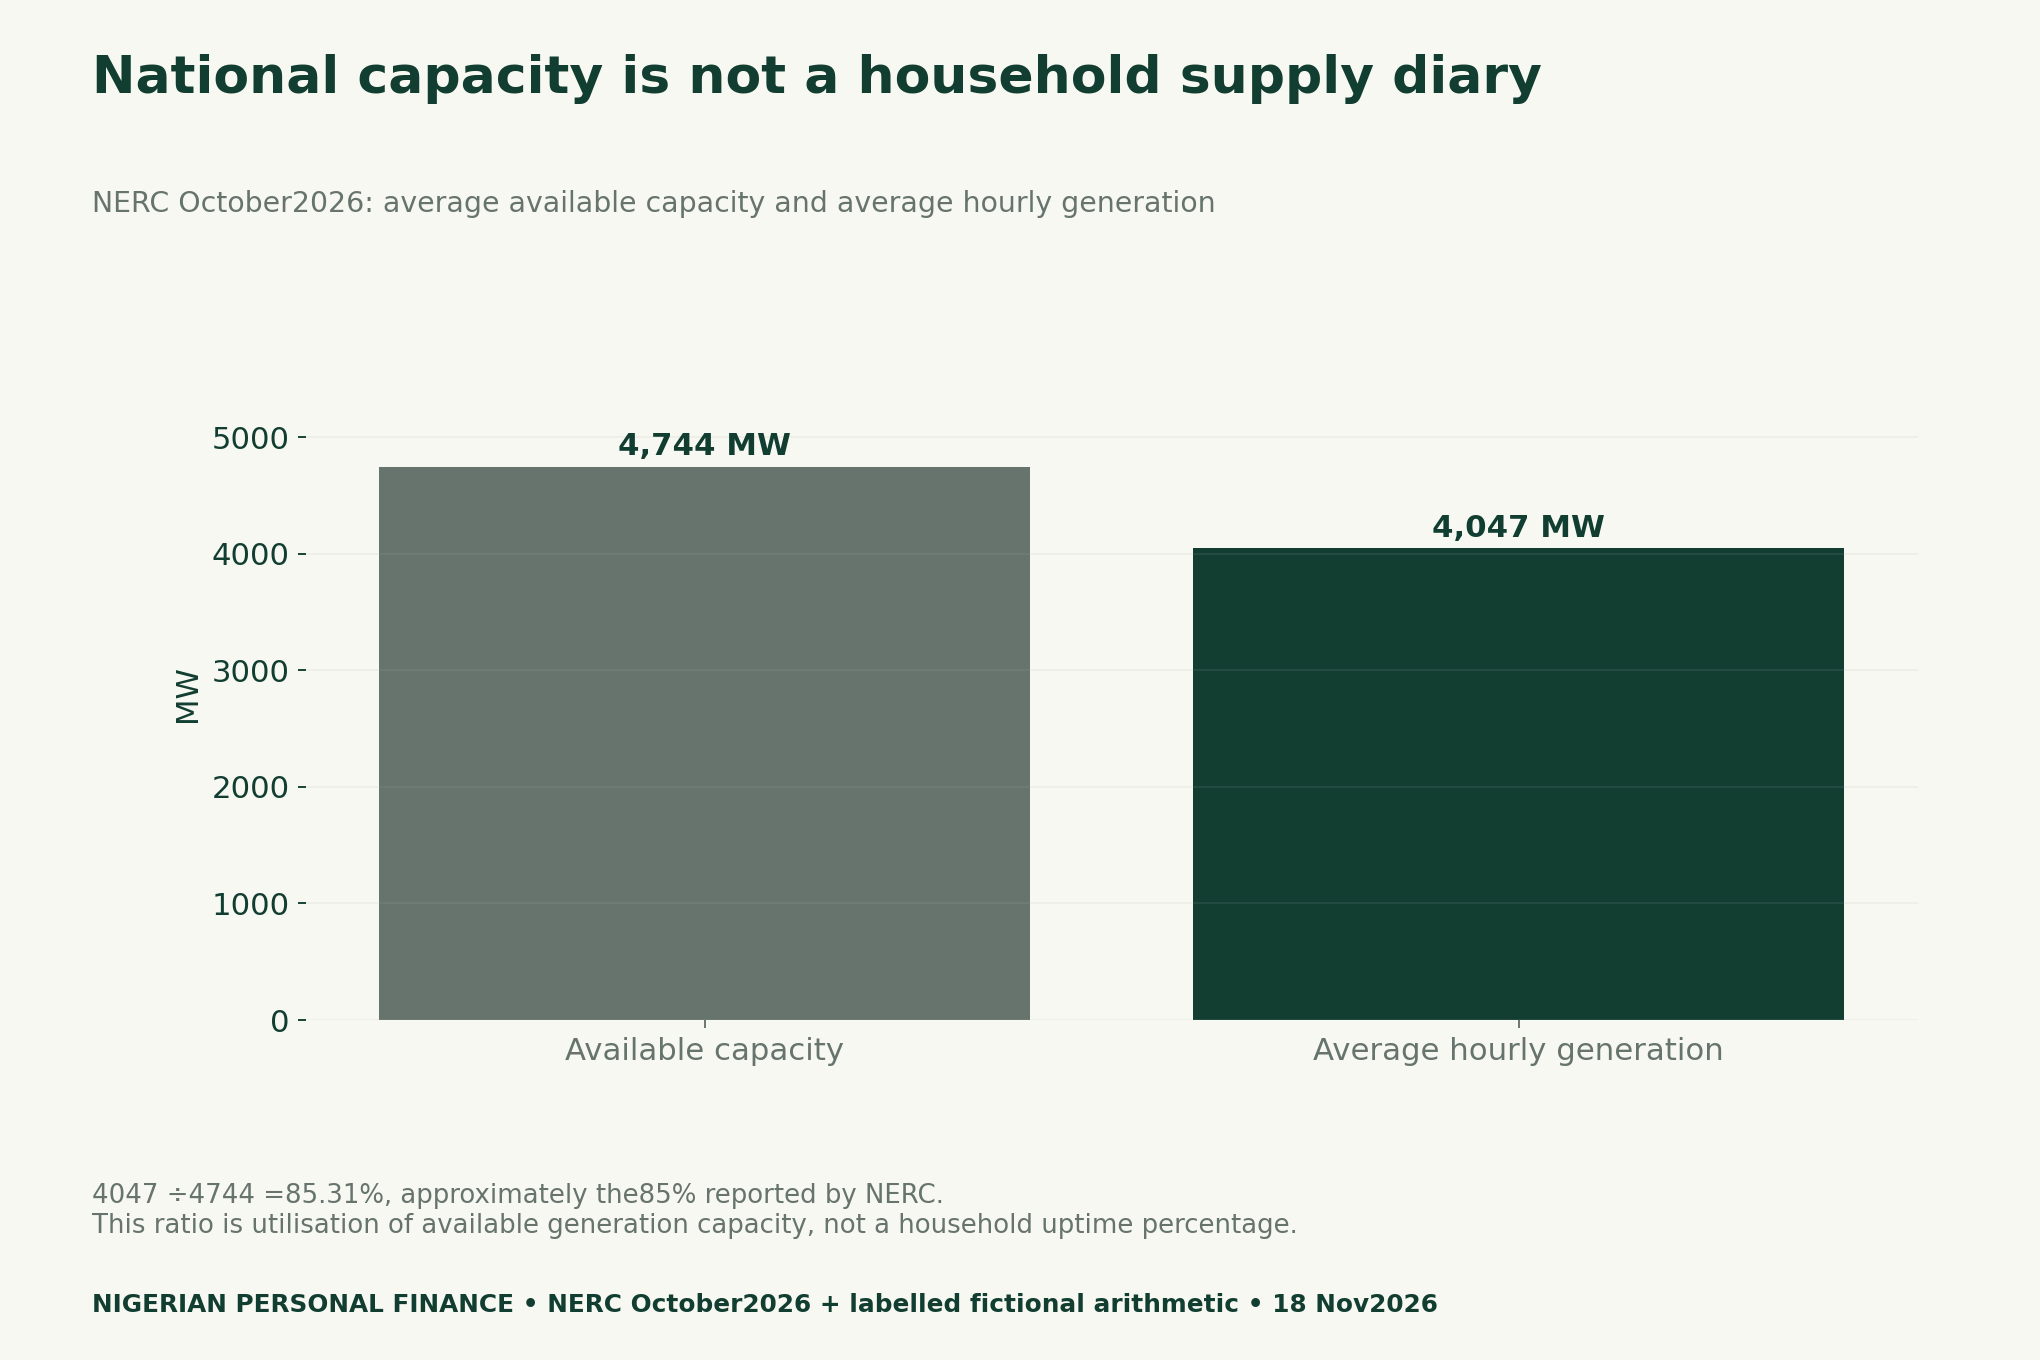
The denominator is available generation capacity, not the number of hours in a month. It is also not installed capacity, household demand or energy delivered to your meter. Applying the 85% ratio to 24 hours would answer a different question from the one NERC measured and would create an unsupported local estimate.
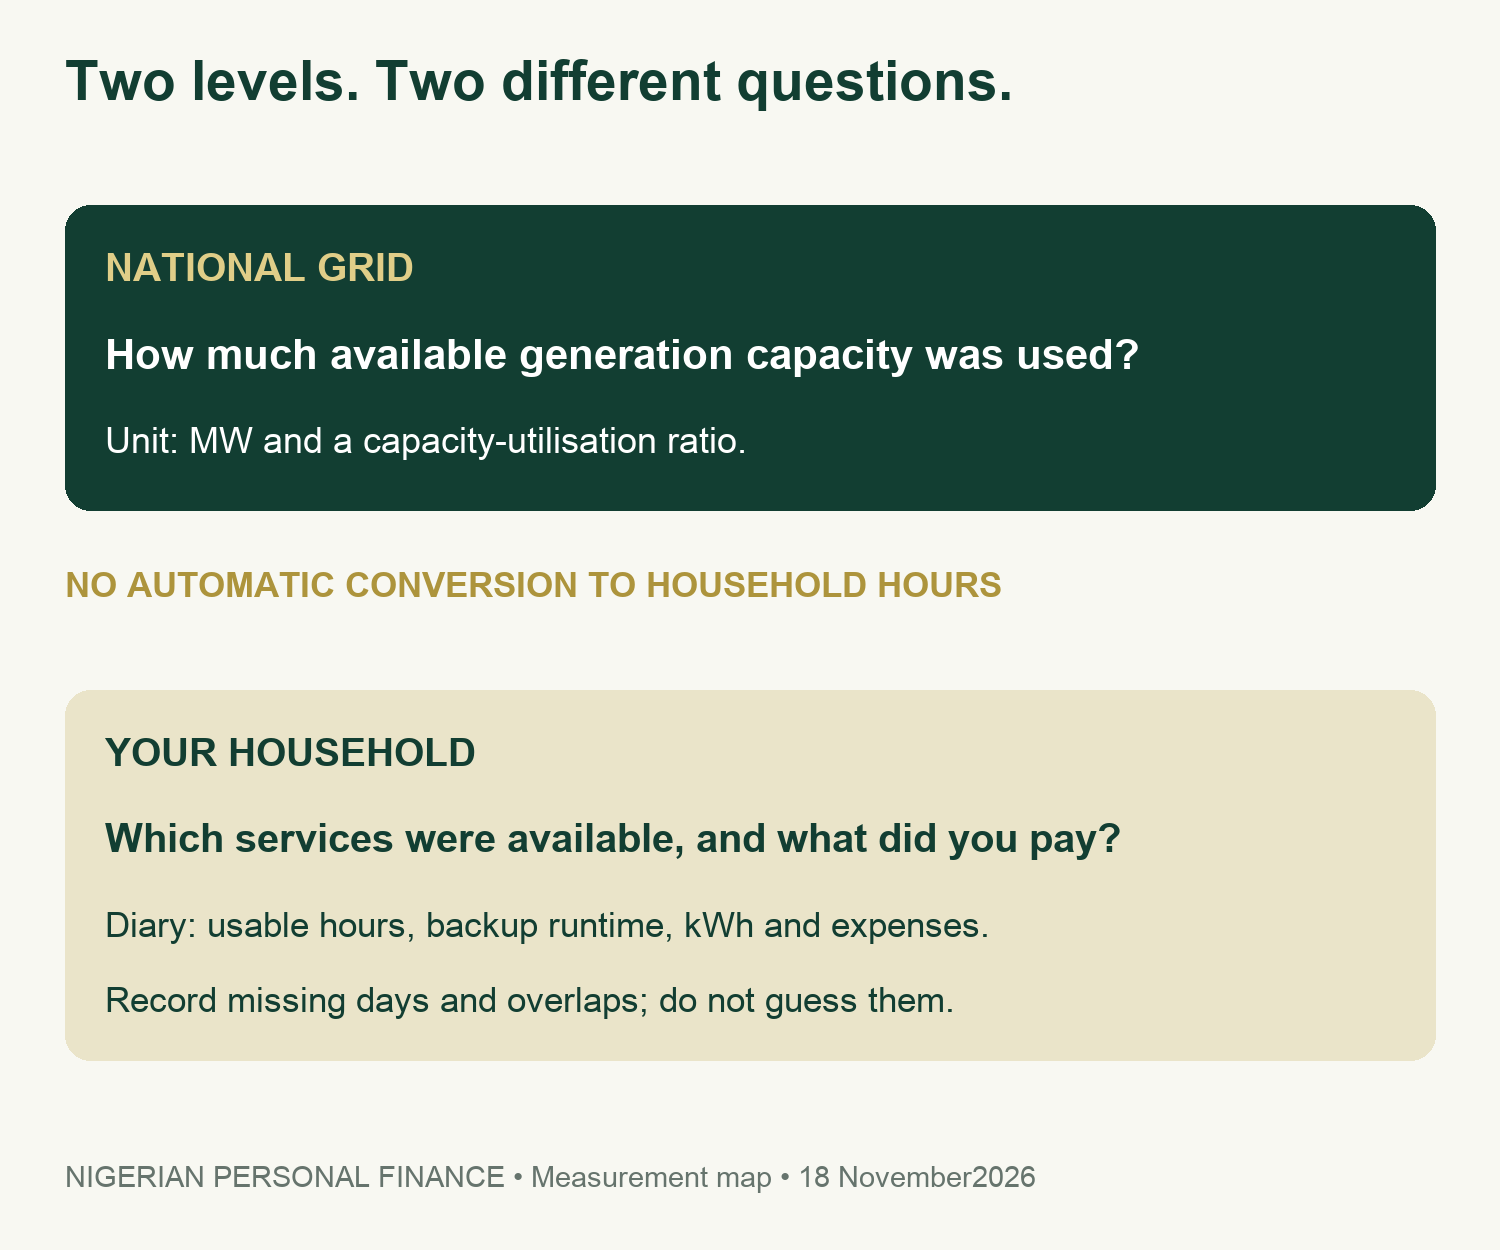
Keep units visible. MW describes power; kWh describes energy over time. One kW used for one hour equals one kWh. A national average expressed in MW cannot be inserted directly into a household tariff calculation expressed per kWh. A home’s appliances, hours of use and purchased units need their own records.
Build a four-week diary around useful service
Choose a consistent observation window, such as 28 days. For each day, record usable grid hours under your own stated definition, backup runtime, purchased meter units and actual payments. Also note any essential task that could not be completed. A light turning on does not necessarily mean every needed appliance could run.
Keep missing observations blank and explain why. Zero should mean that you observed none, not that you forgot to record the day. If you monitored only evenings, label that window instead of claiming full-day coverage. A household diary can support its own budget; it is not a representative reliability survey.
Avoid double counting time. Backup charging, backup use and grid availability may overlap, depending on the setup. Do not add them into a 24-hour total without a consistent definition. The diary provides an overlap-notes column because an apparently precise total can otherwise disguise incompatible observations.
Next, distinguish money paid from energy consumed. A prepaid purchase can cover later use, while a bill payment may settle earlier consumption or arrears. Retain dates and meter units where available. Your cash budget and your usage record answer related questions, but they need not match in the same week.
Use runtime and cost assumptions transparently
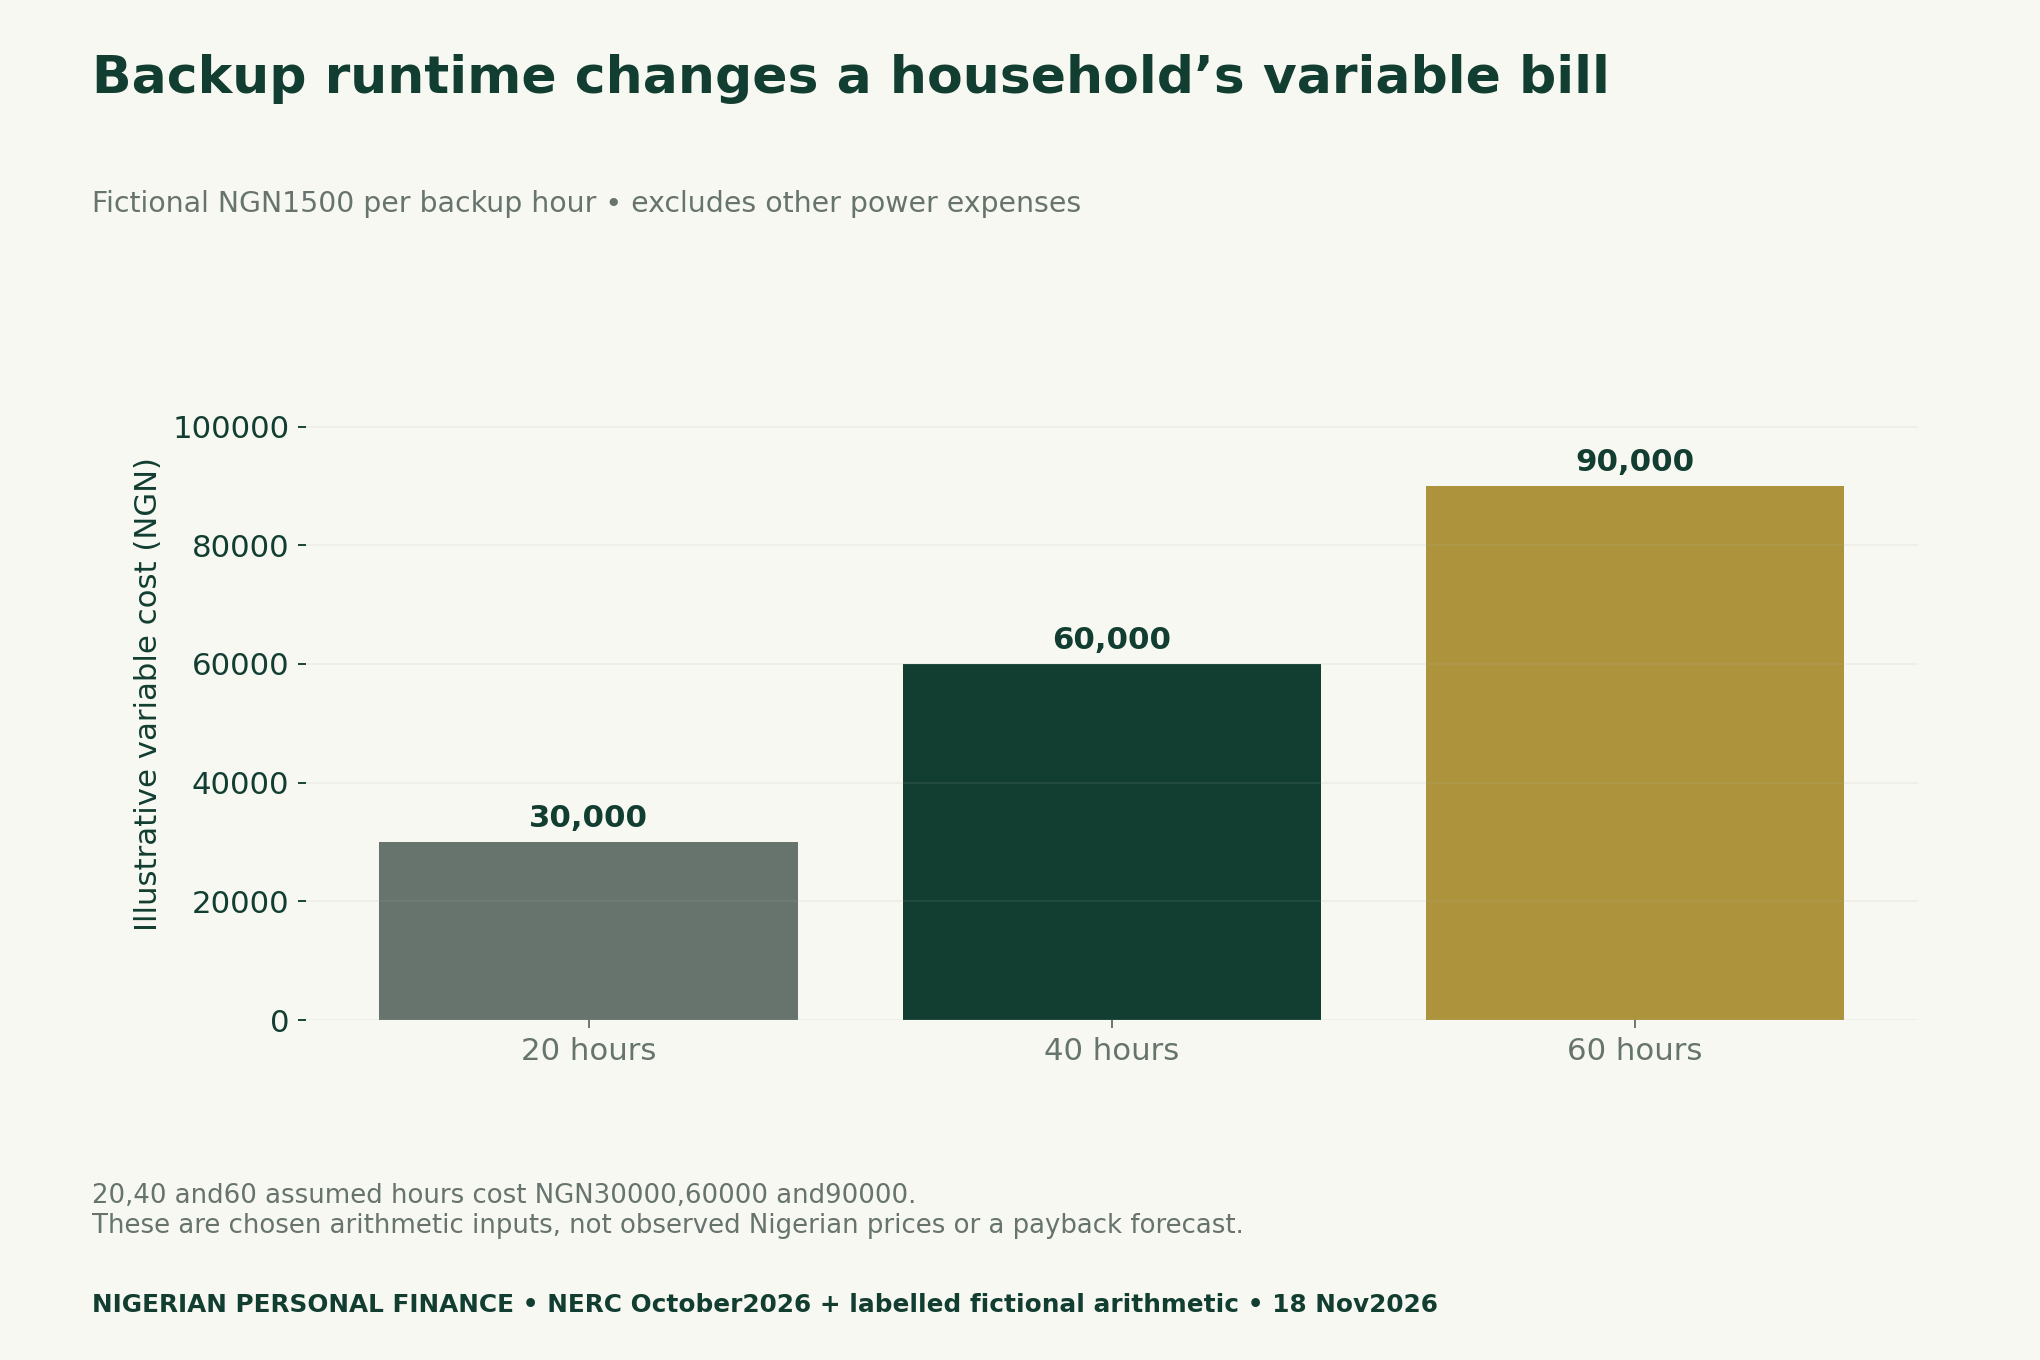
Suppose the variable cost is assumed to be NGN 1500 per backup hour. Then 20 hours costs NGN 30000,40 hours NGN 60000 and 60 hours NGN 90000. The multiplication is useful precisely because its inputs are visible. It should never be described as an observed national average or a quote from a supplier.
Use your own properly supported cost basis for a real estimate. Some expenses vary with runtime, others with energy delivered, and some are fixed or irregular. A single hourly assumption may omit purchase costs, servicing, charging losses, replacements and financing. Label those exclusions before comparing options.
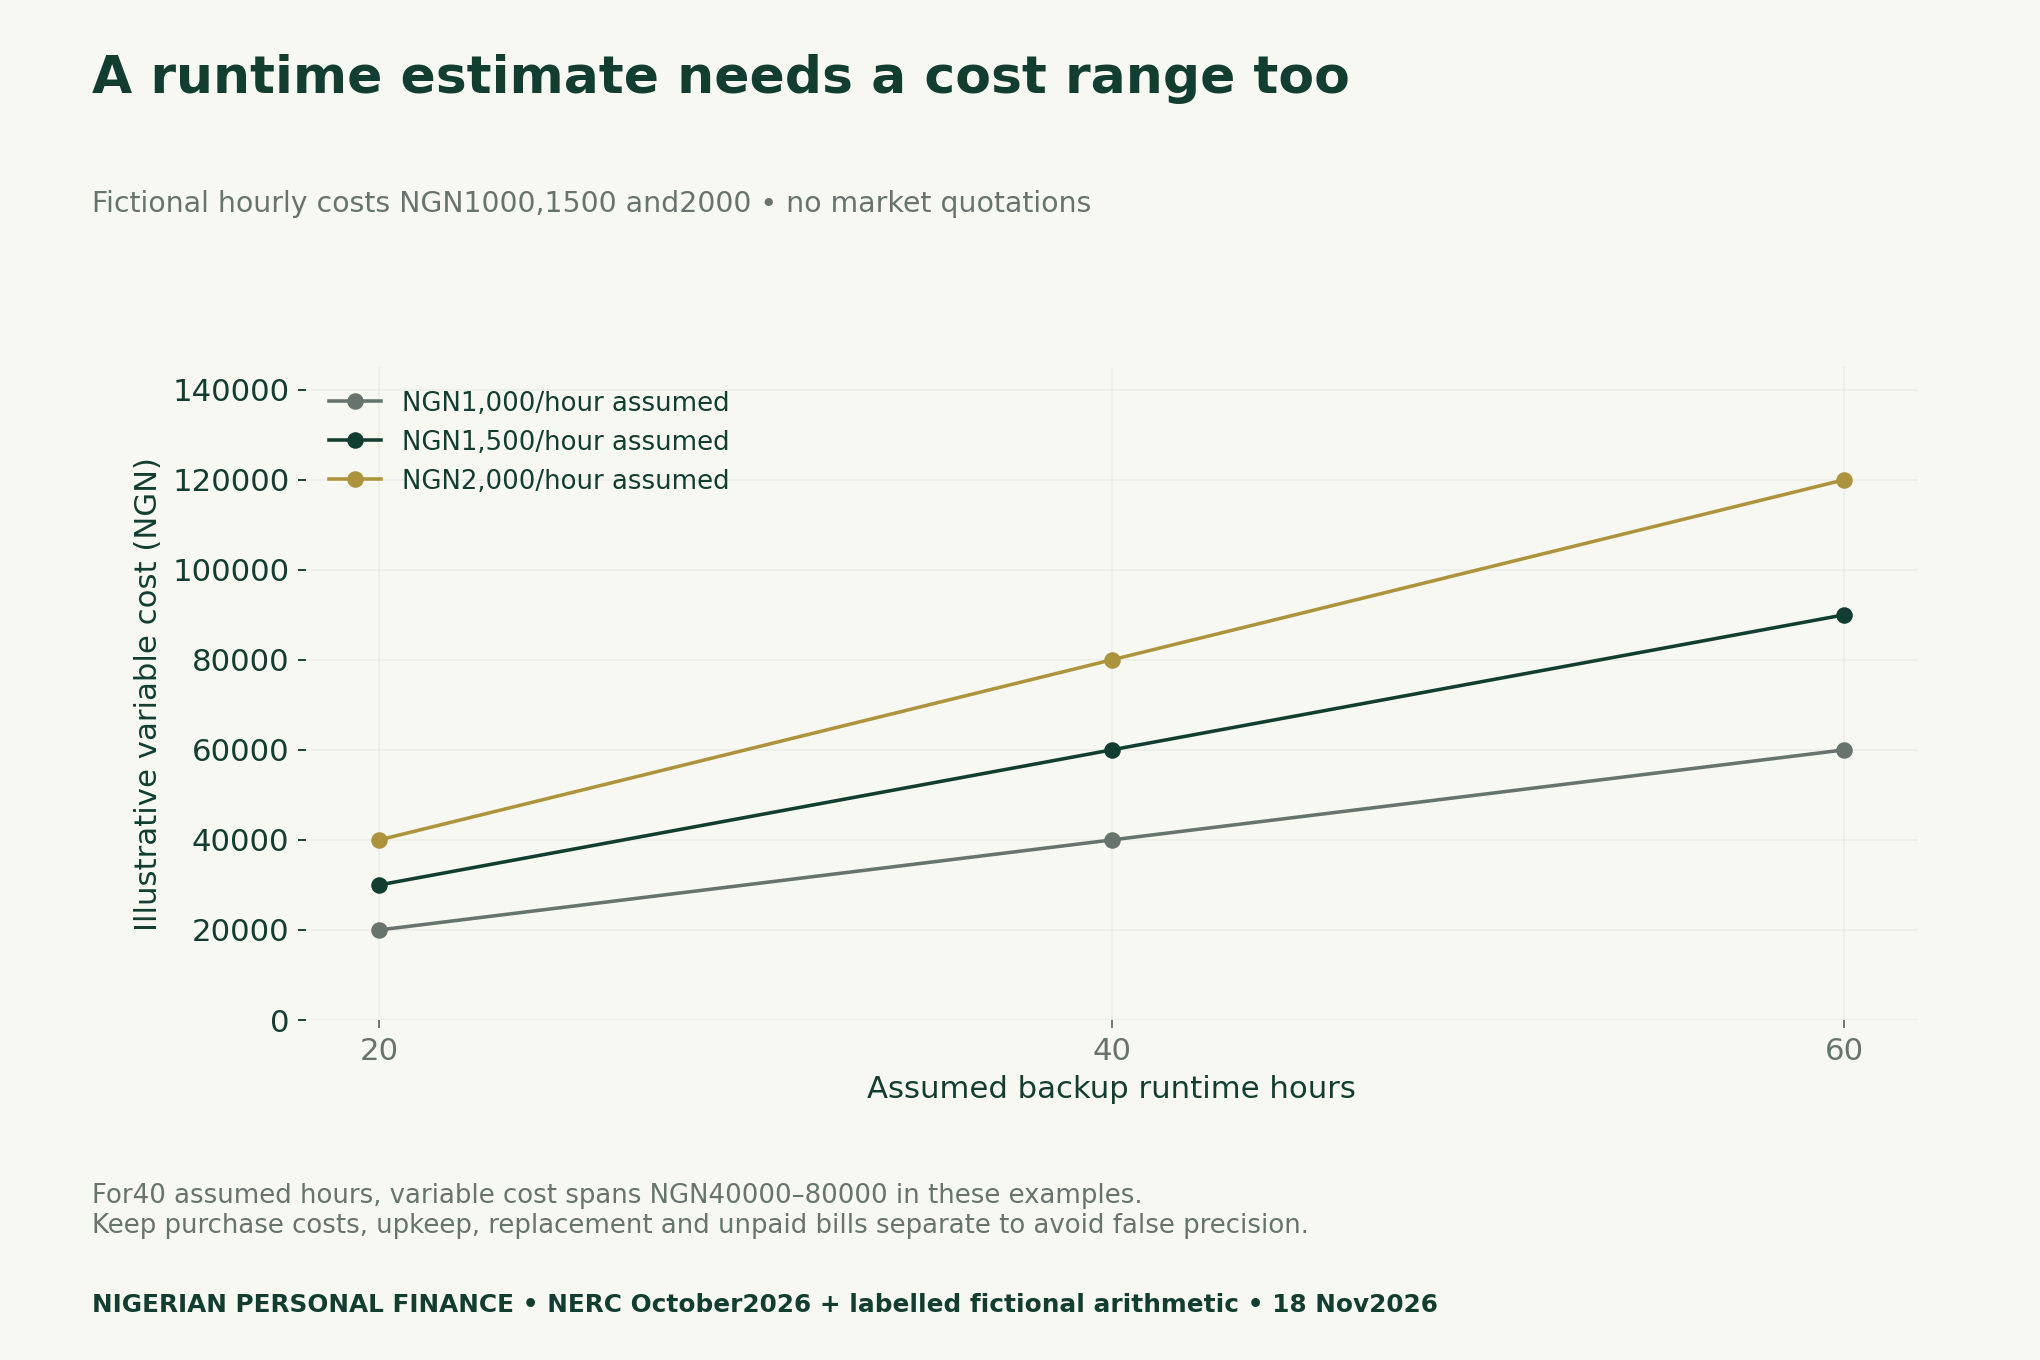
A range can be more honest than a single number. At 40 hours, the invented NGN 1000 and NGN 2000 assumptions produce NGN 40000 and NGN 80000. However, that range does not quantify the uncertainty in your home. Replace it with documented inputs or leave the estimate unresolved if the evidence is not available.
Compare quoted scope, not just a headline price
When considering a service or equipment quote, record what it covers, the date, the intended load and any excluded expenses. Compare the same service requirement and time horizon. A lower upfront amount does not establish a lower total cost, and a larger device does not automatically provide better value for a particular home.
This article gives no wiring, generator-placement or installation instructions. Equipment suitability and safety require an appropriately qualified provider and the relevant requirements. The worksheets do not promise payback or recommend a purchase; their purpose is to make budget inputs and gaps visible.
For a broader price-period check, our salary-versus-inflation guide distinguishes a national benchmark from a household basket. The same discipline applies here: an official aggregate can inform context without describing one home’s exact experience.
Method, limits and four downloadable CSV tools
We checked NERC’s official release on 18 November 2026 and calculated 4047 divided by 4744. The national comparison uses its displayed values. All backup-cost cases are fictional and exclude other costs; no household was surveyed. The three charts separate national context, one assumed cost and a broader sensitivity range.
Your Personalized Financial Plan
Get expert financial advice tailored exclusively to your goals. Receive a custom roadmap in just 1-3 business days.
Get Started- NERC source-measure and unit dictionary (CSV)
- Fictional backup-cost sensitivity calculations (CSV)
- Blank four-week household power diary (CSV)
- Blank like-for-like power quote ledger (CSV)
Suggested citation: Nigerian Personal Finance, “Nigeria’s Grid Numbers Are Not Your Home’s Power Budget”,18 November 2026. Primary source: NERC October operational release,11 November 2026. Original calculations, measurement map and blank private tools by this publication. National capacity utilisation is not household electricity availability.