






Nigeria salary statistics and self-employed income do not necessarily describe the same workers or the same kind of money. Before using a headline figure to judge a household budget, check who was measured, what income means and when the observation was made.
SysIN’s earnings report published 11 November 2026 brings renewed attention to these distinctions. For the workforce split here, we checked the original NBS Labour Force Survey for Q 2 2024. Its national figures are 85.6% self-employment,14.4% employees and 93.0% informal employment. Those are 2024 observations, not a newly measured 2026 split.
Nigeria salary statistics: check the self-employed denominator
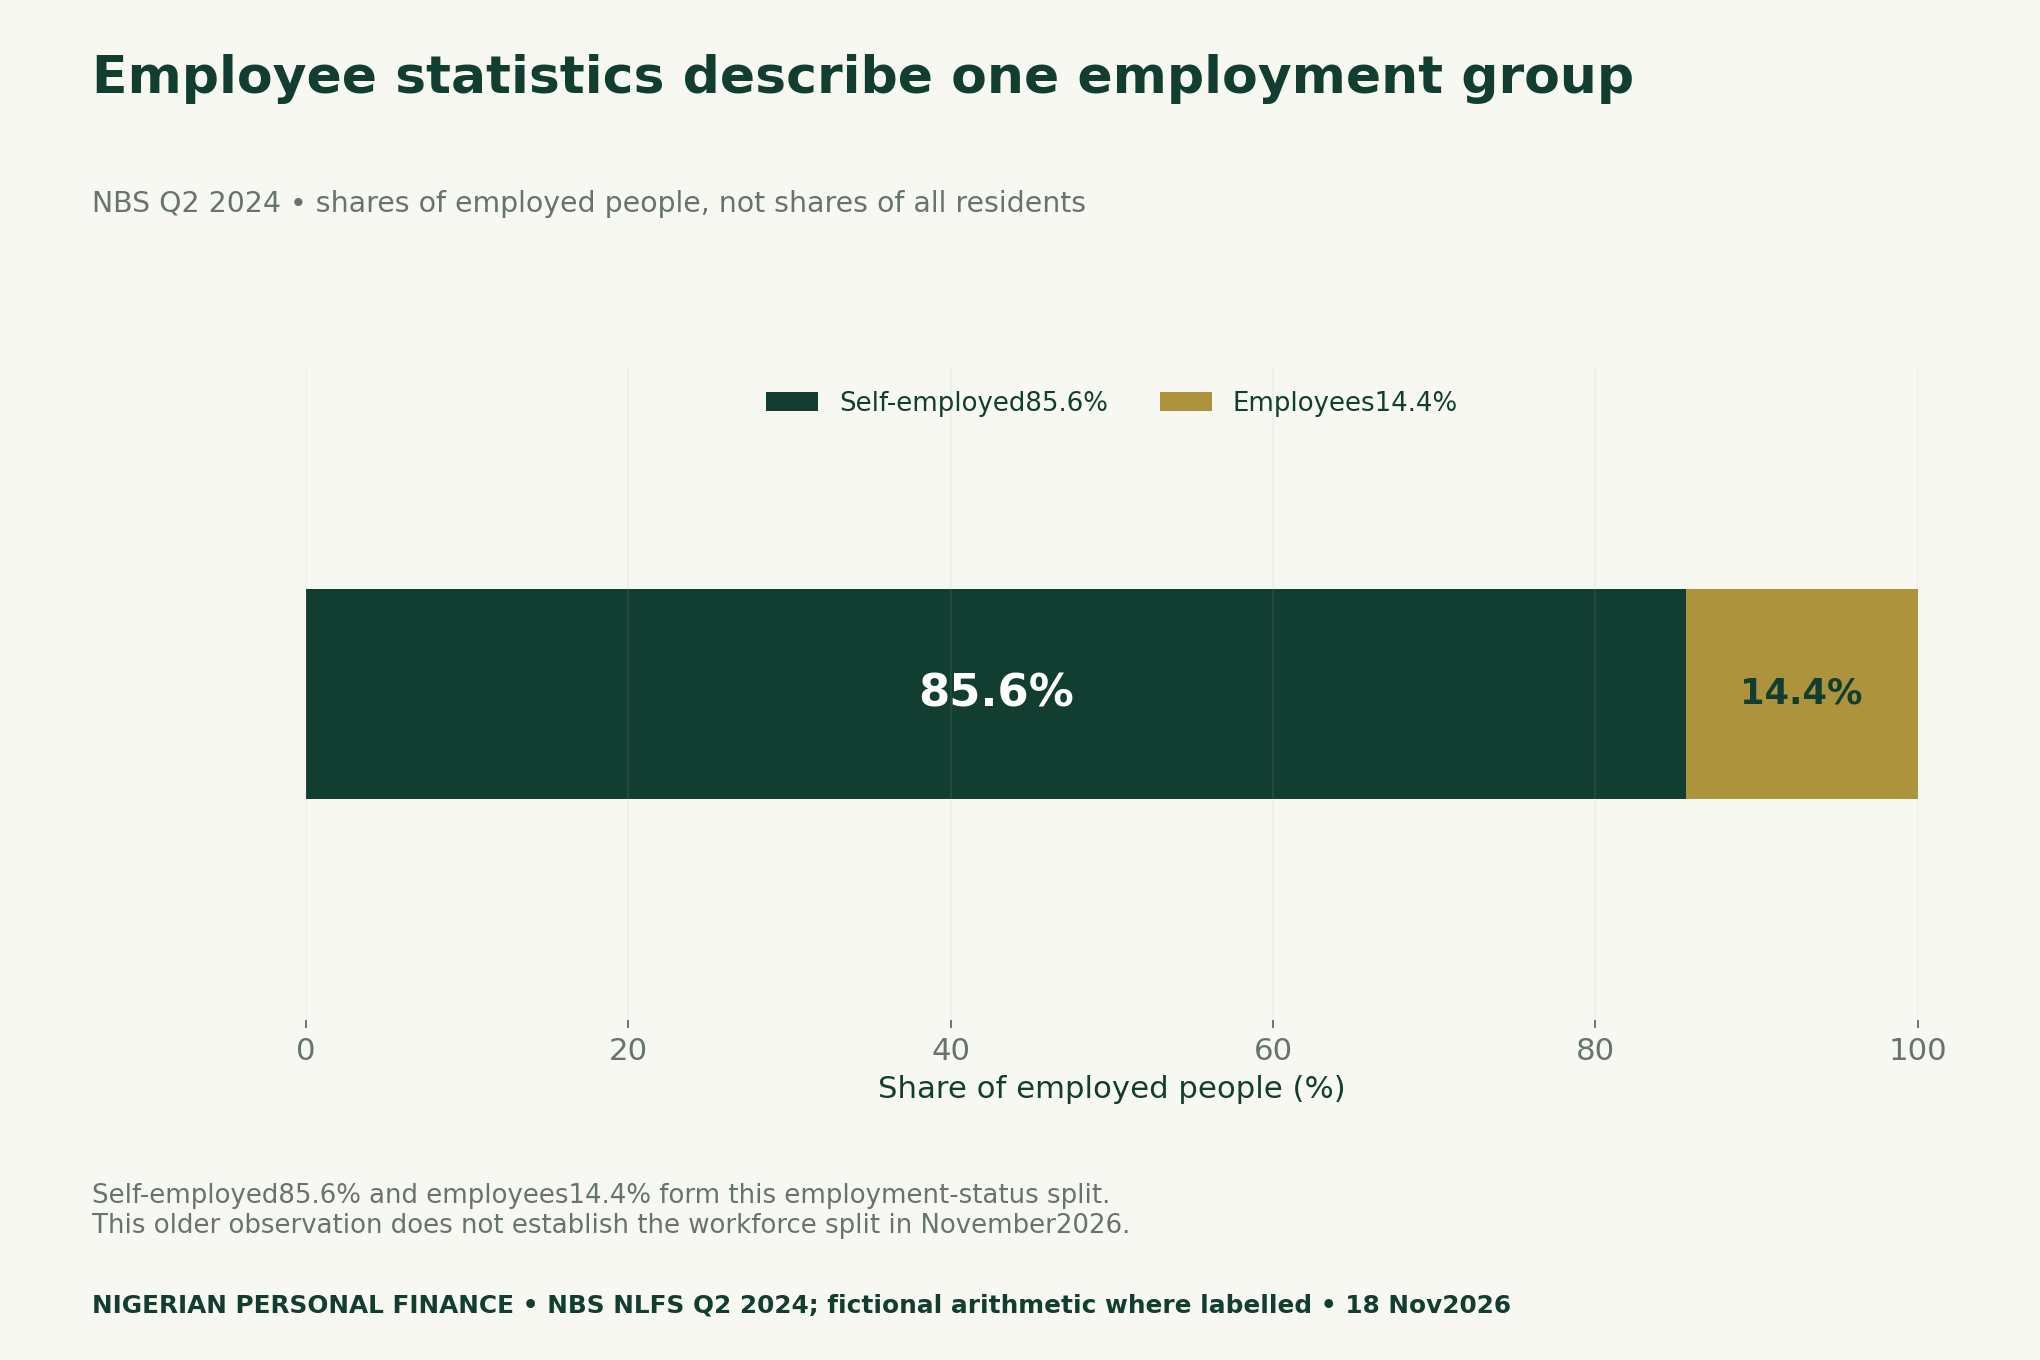
A mean salary for employees answers a question about employees in its stated dataset. It cannot automatically stand in for the income of traders, own-account workers or every employed person. That does not make the employee measure useless; it means its population boundary belongs beside the number.
The distinction also matters inside a household. One adult may earn wages while another runs a small business, and the household may have additional income sources. An individual employee statistic is not the same as combined household income. Keep the unit of analysis clear before comparing it with bills paid for several people.
Employment status and informality are different views
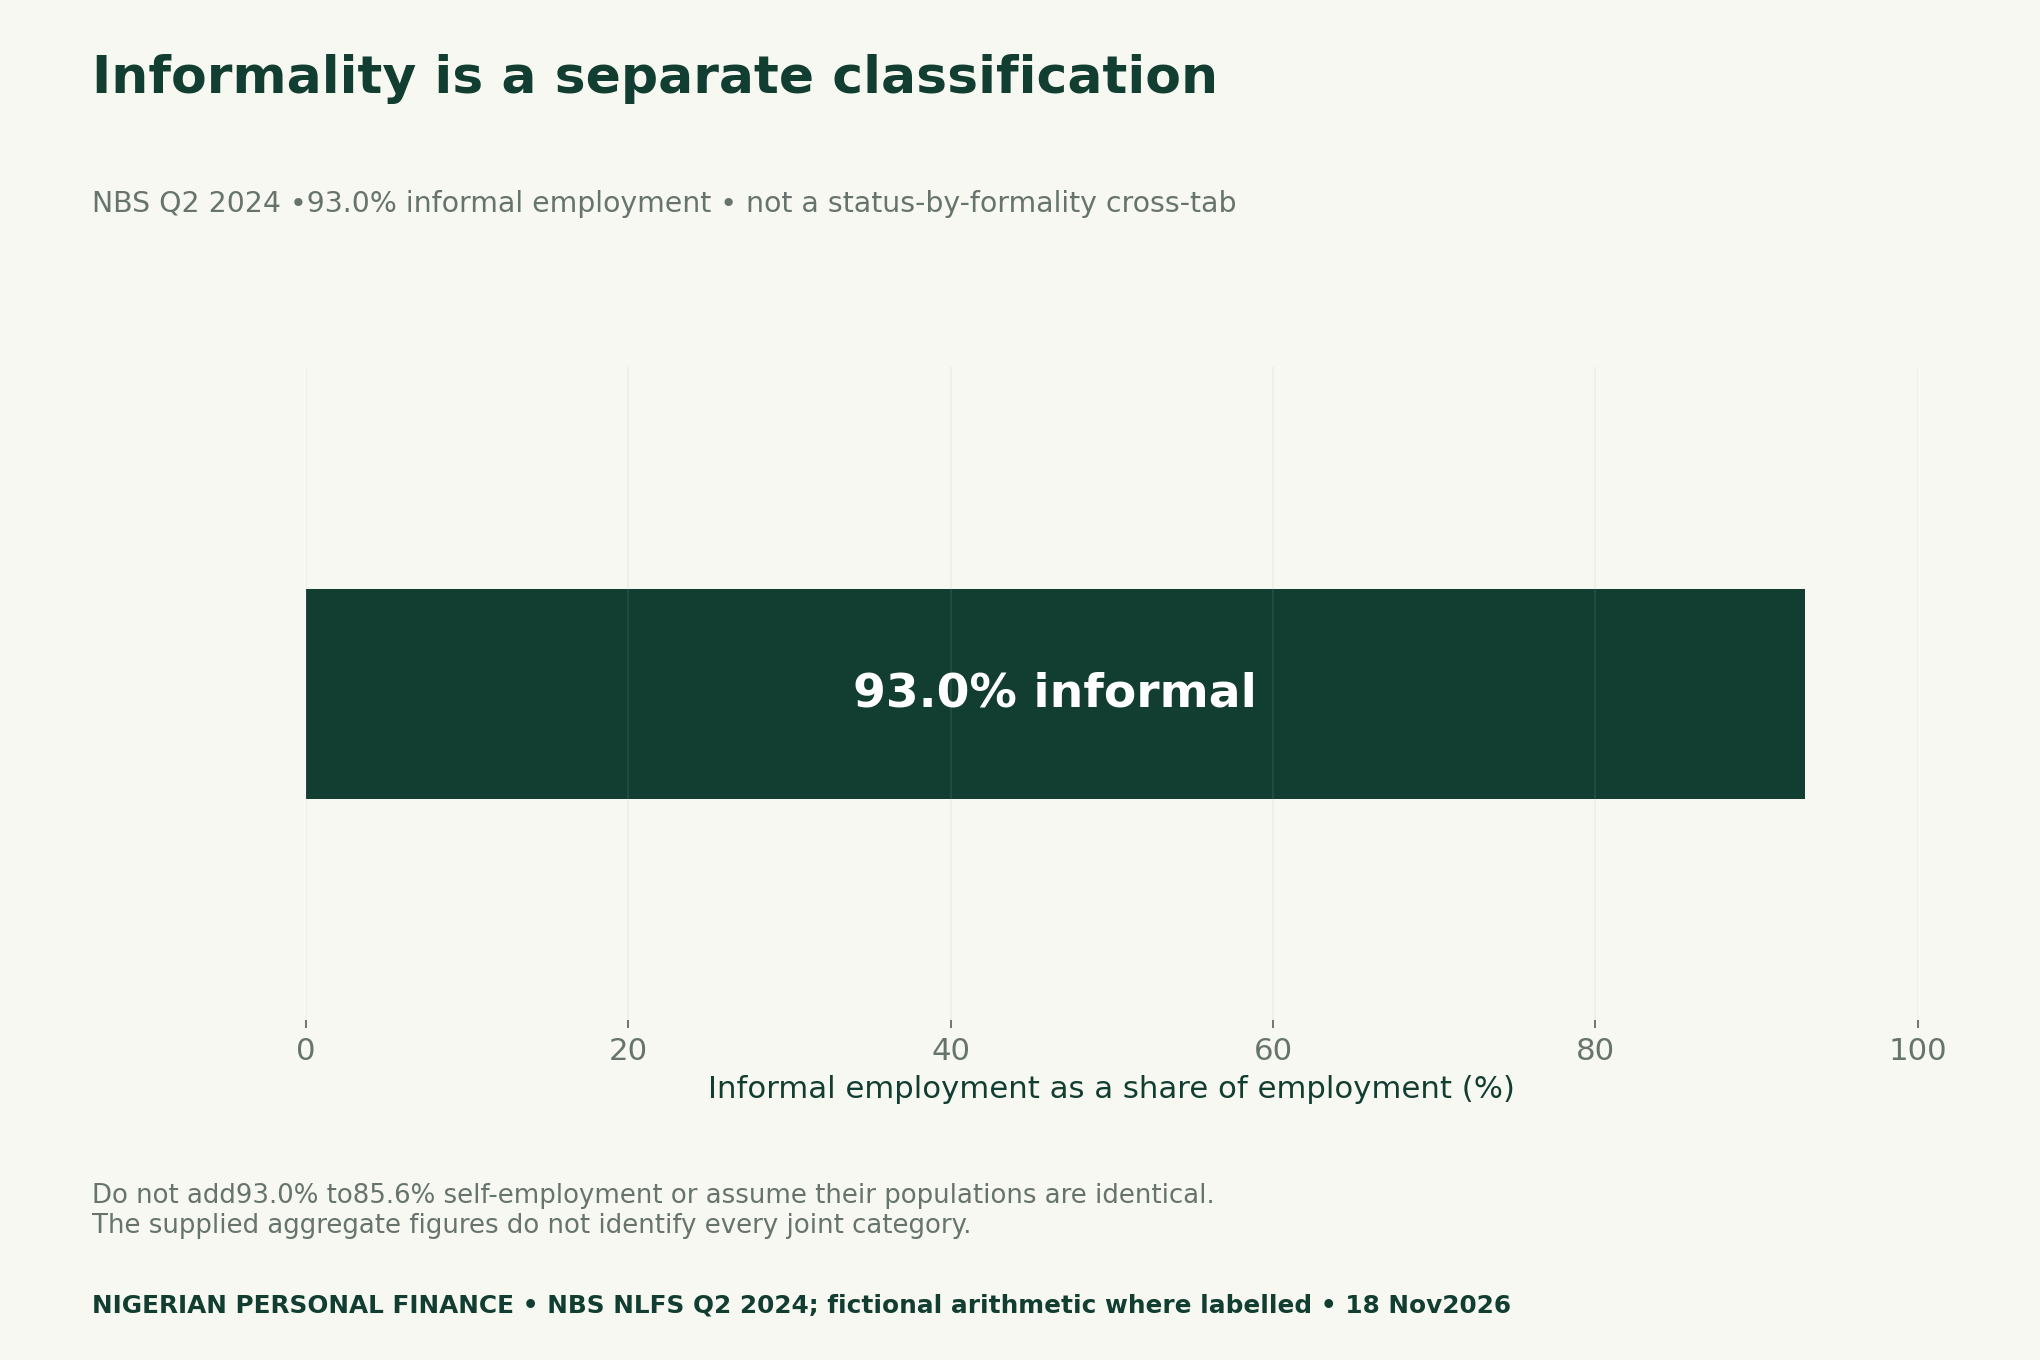
Self-employment identifies an employment-status group. Informality is a different classification of work. Their headline percentages therefore overlap conceptually rather than forming extra pieces of one pie. Adding 85.6% and 93.0% creates no meaningful share, and assuming that every self-employed person is informal is unsupported by these totals.
For the same reason, do not treat the 14.4% employee share as a measured formal-employment share. The two labels answer different questions. To describe their intersection, obtain a properly defined cross-tabulation or relevant microdata analysis rather than relabelling the aggregate bars.
We keep the two national views in separate figures and retain their observation period in every download. This prevents a 2026 publication date from quietly turning older survey evidence into a current estimate. A later report may discuss an old observation accurately; the dates still need to be visible.
Receipts, invoices and salary are not interchangeable
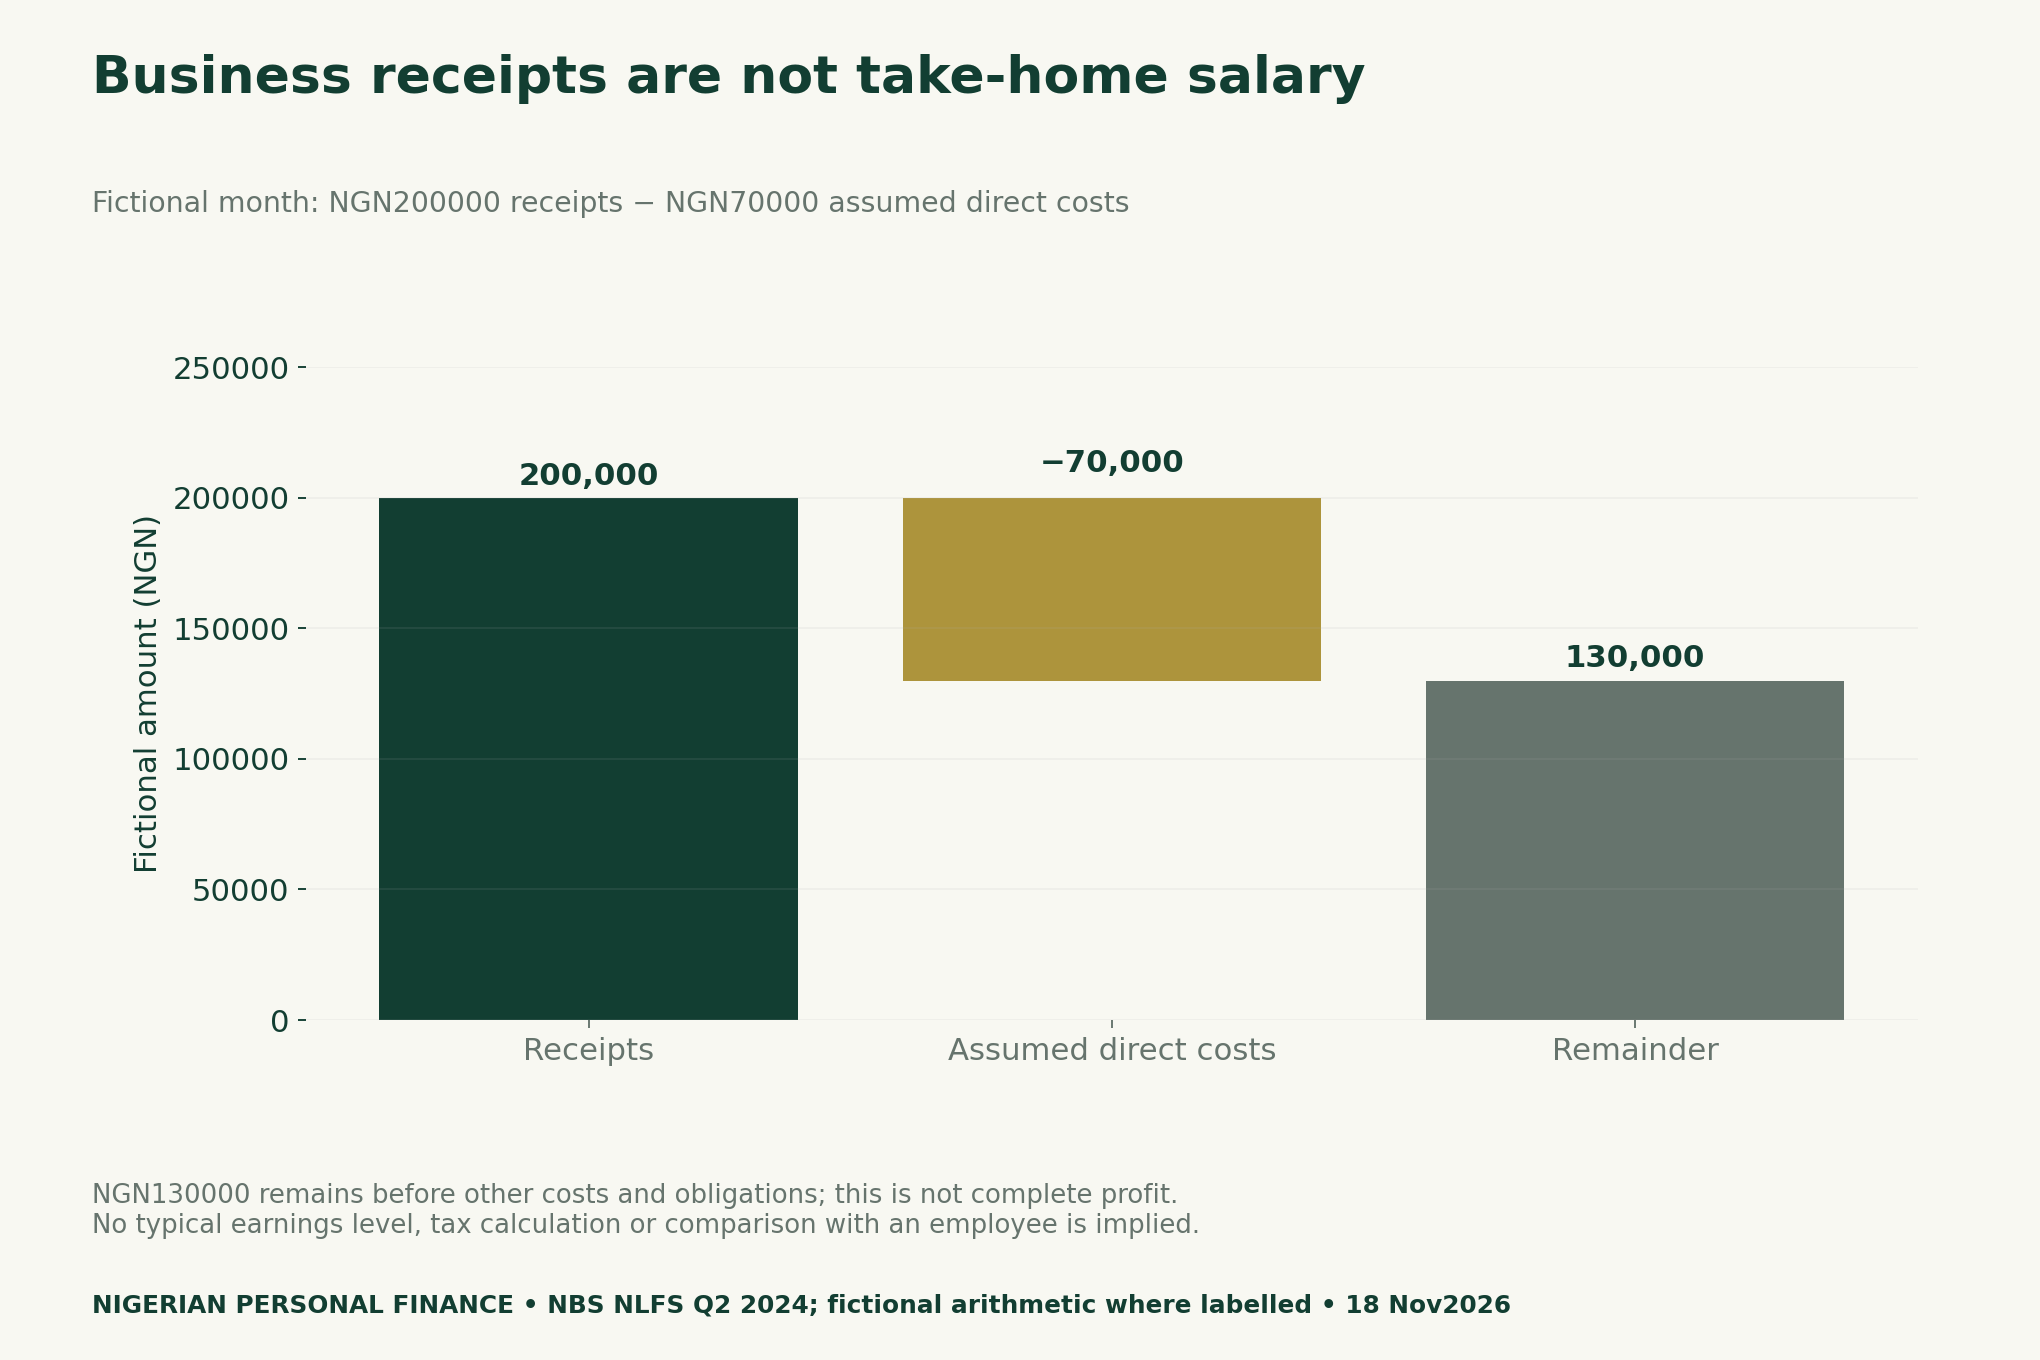
Consider an invented month with NGN 200000 of collected business receipts and NGN 70000 of assumed direct costs. The subtraction leaves NGN 130000. Calling that remainder take-home salary would skip other business expenses, tax, saving for replacement and any additional obligations. It is not automatically money available for household spending.
An invoice that has not been paid is another distinct item. It may matter for business accounts, but it is not cash already collected. A cash-flow comparison should show actual receipts and payment dates. A profit comparison may use a different accounting basis; explain it rather than switching between the two.
Owner withdrawals require care too. Taking cash from a business can change where money is held without creating new income. A private ledger should distinguish money collected, business costs, unpaid invoices and withdrawals. The blank tool separates those columns and deliberately does not output an asserted salary figure.
Use four checks before comparing a headline with your records
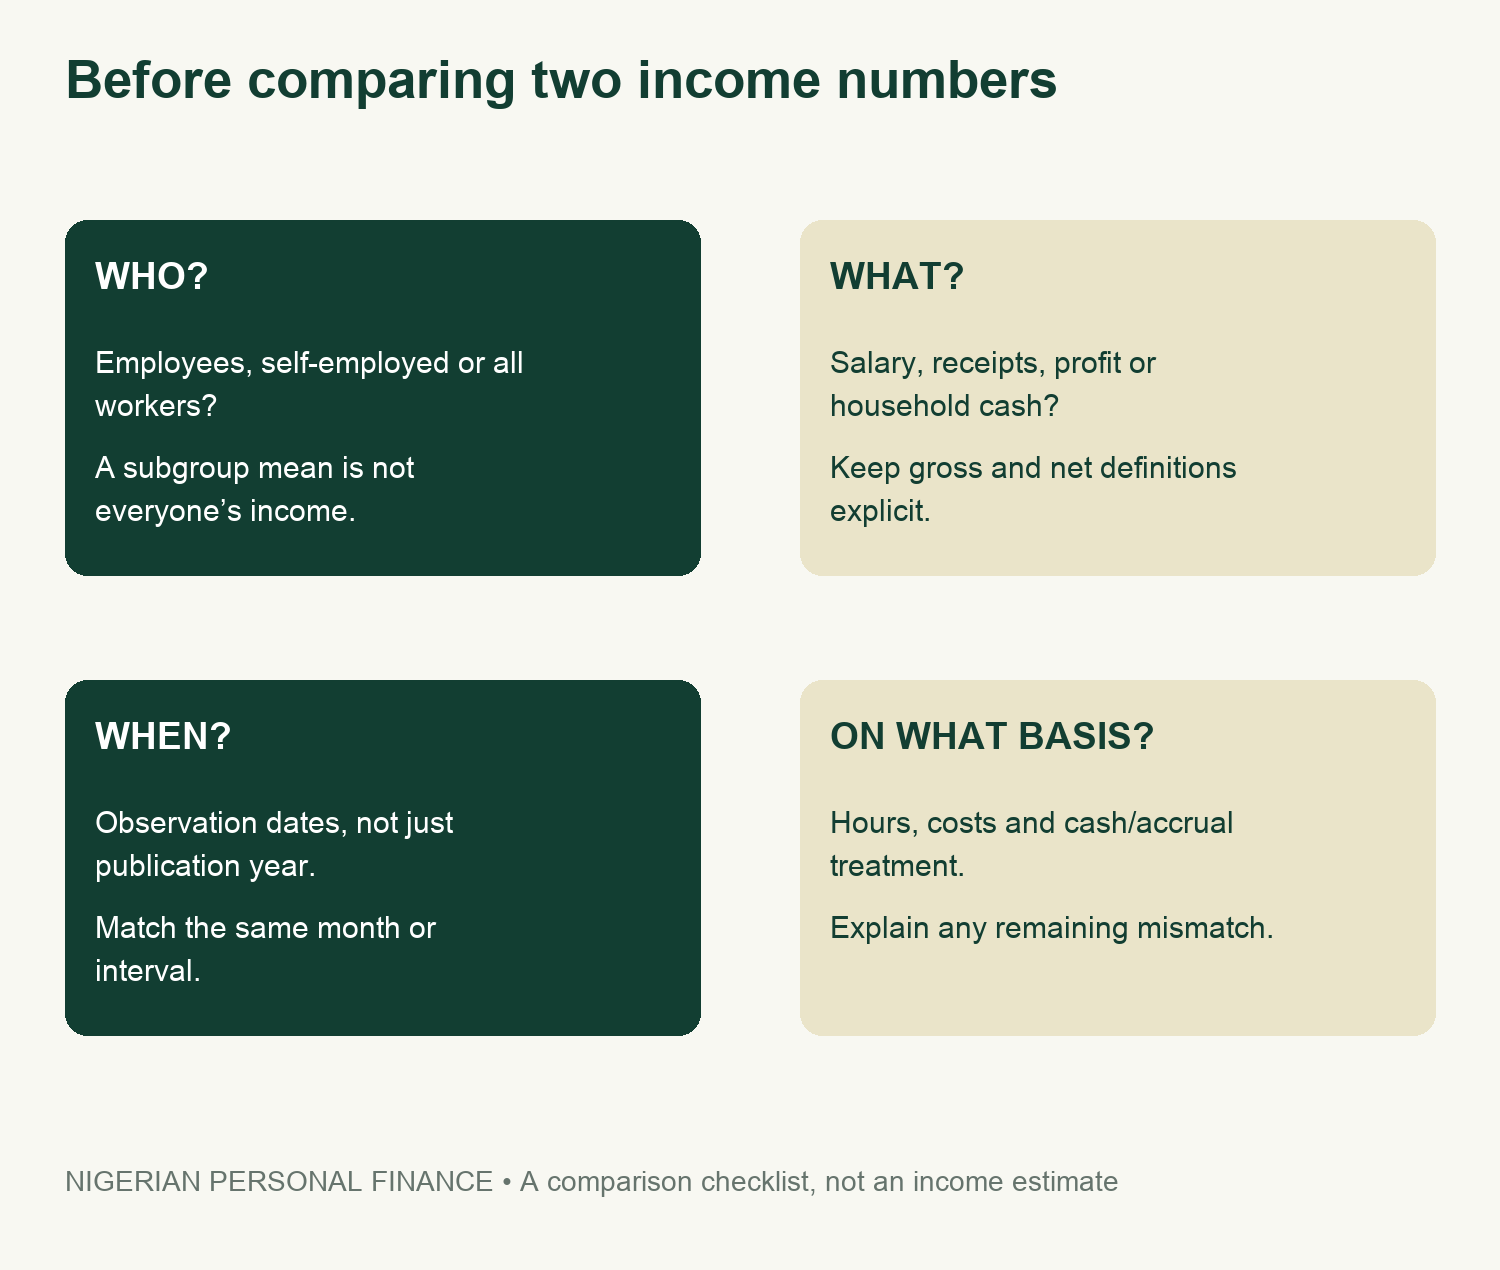
First, identify the population. Is the measure about employees, all employed people, a selected occupation, platform users or survey respondents? A voluntary survey and a national probability sample do not have the same scope. Read the source’s coverage before transferring its result to your own situation.
Second, identify the income concept. Gross pay, take-home pay, business turnover, profit and total household resources are different measures. A larger turnover figure does not establish that a business owner has more spendable income than an employee with a smaller salary. The omitted costs and obligations could change the comparison.
Third, match the observation period. Publication dates can be much later than fieldwork dates. If you adjust older money values for prices, record the exact interval and chosen index. Our pay-versus-inflation analysis shows why matching periods matters and why national CPI is not every household’s inflation.
Finally, compare the work and accounting basis. Monthly totals can reflect different hours, irregular jobs or unpaid business administration. A rough hourly division can be informative only if the time record is comparable. Do not claim a precise hourly advantage when hours or income definitions are missing.
Keep private records private and conclusions proportionate
The worksheets are for local, voluntary use. They do not ask readers to post income statements, account numbers, client identities or payslips in public. Use anonymised descriptions where possible and retain sensitive source records securely. Blank cells indicate missing information, not a zero income or zero cost.
Your Personalized Financial Plan
Get expert financial advice tailored exclusively to your goals. Receive a custom roadmap in just 1-3 business days.
Get StartedThis article does not estimate a typical Nigerian salary, recommend a career change or predict income from self-employment. It offers a way to assess whether a comparison is valid. A useful conclusion may simply be that the available figures cannot answer the personal question being asked.
Method and four downloadable CSV tools
We retained the NBS Q 2 2024 PDF and checked printed pages 7 and 9 and AnnexA page 21, which appear as PDF pages 11,13 and 25. The national totals agree across these locations. The first two figures use separate aggregate classifications; the third uses one invented business month. No joint distribution or new survey result is constructed.
- NBS population and reference-period audit (CSV)
- Fictional receipts-minus-costs example (CSV)
- Blank income-comparison checklist (CSV)
- Blank private receipts and obligations ledger (CSV)
Suggested citation: Nigerian Personal Finance, “Nigeria Salary Statistics: Compare the Right Workers”,18 November 2026. Primary source: NBS Labour Force Survey Q 2 2024; current discussion hook: SysIN earnings report,11 November 2026. Original comparison framework and fictional arithmetic by this publication. Preserve the population and reference period when reusing a chart.