







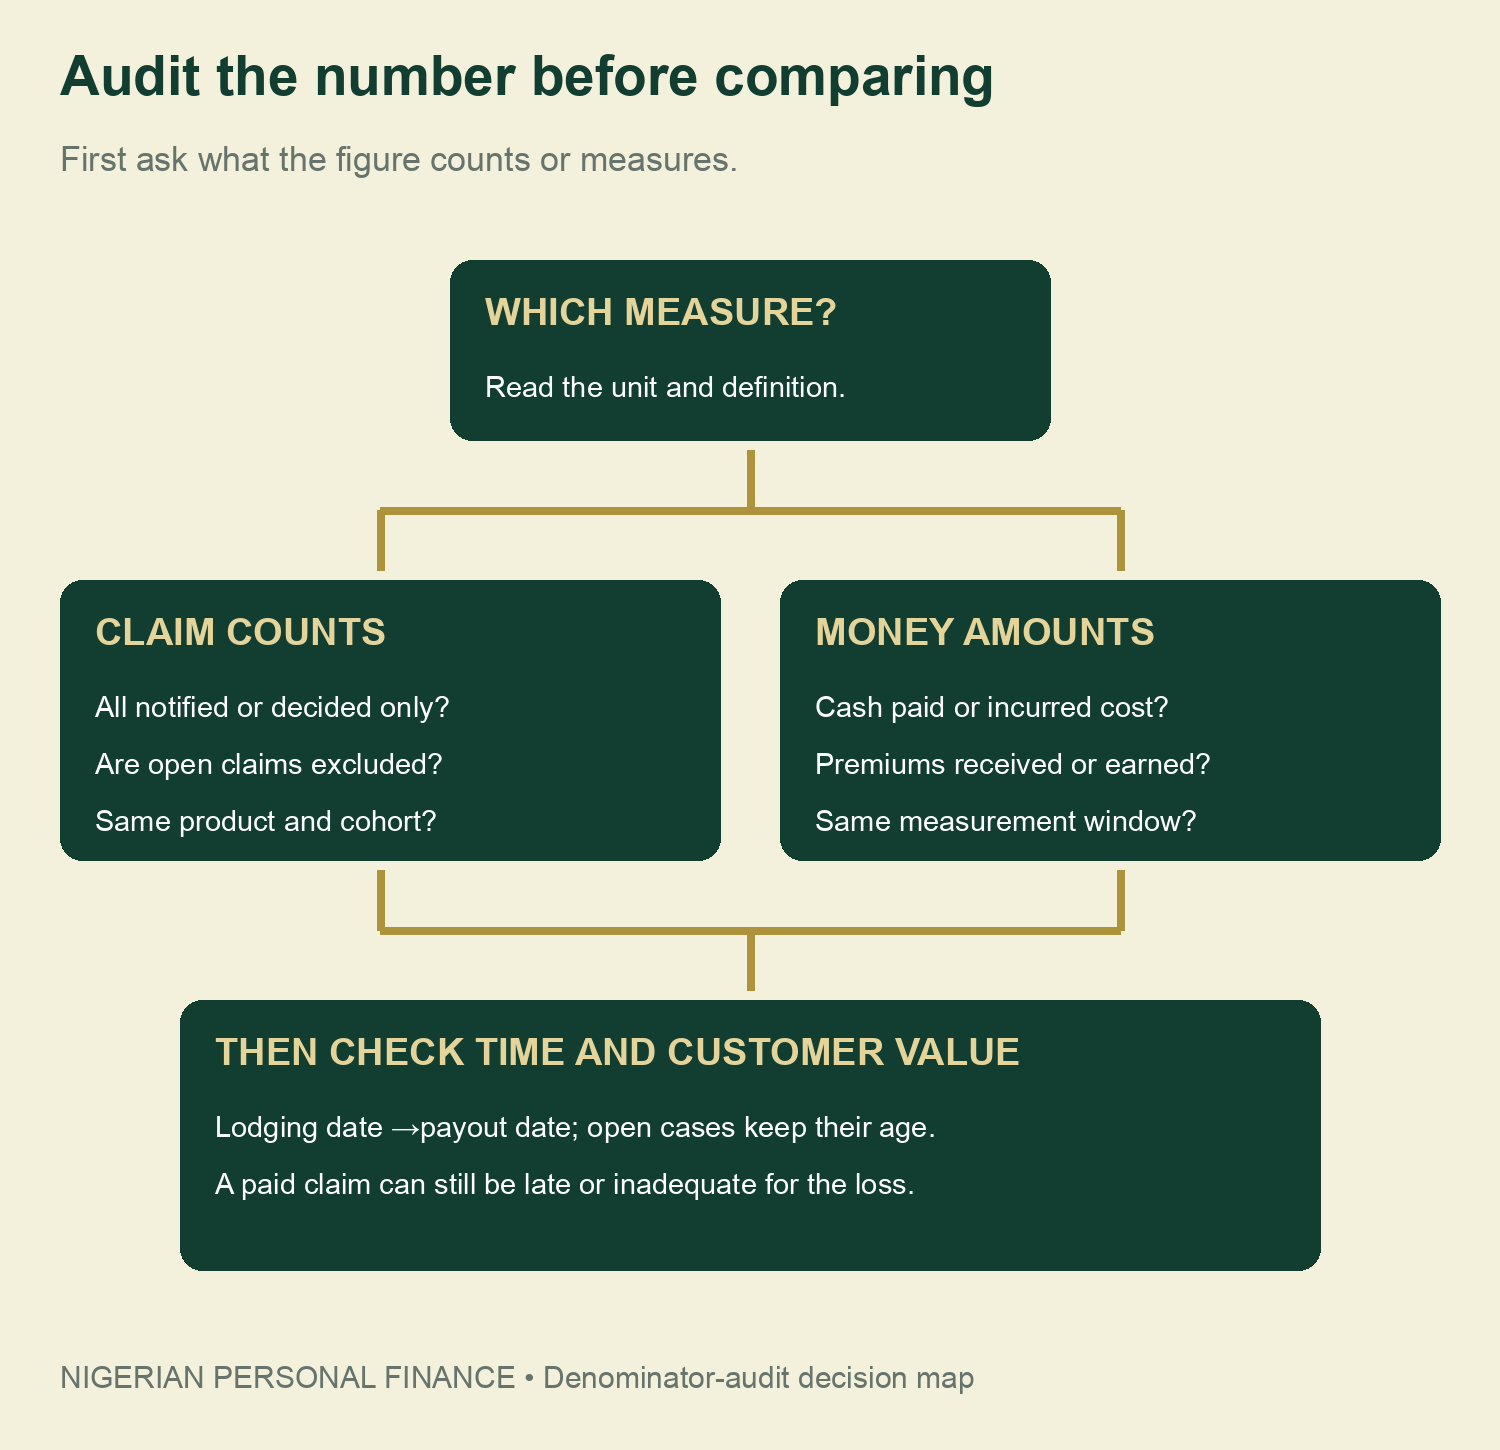
An insurance claims settlement ratio in Nigeria is useful only when you know what it measures. A percentage based on claim counts answers a different question from a ratio based on cash amounts. Even two count-based figures can differ because one includes open cases and the other excludes them.
This report shows how to audit those definitions before comparing disclosures. It uses a new international measurement paper, three clearly fictional charts, a decision-map infographic and four free CSV tools. It does not rank insurers, estimate Nigerian claims performance or calculate a household’s chance of receiving a payout.
What the new insurance measurement paper contributes
On 3 November 2026, the IAIS announced a joint publication with CGAP and the Office of the UNSGSA. It connects insurance measurement with financial health. The paper separates coverage and use, product and customer value, and financial-health outcomes. Those layers help explain why policy ownership alone is not proof of useful protection.
Its illustrative indicator table and notes, printed pages 15–16, describe settlement as the share of policyholder-logged claims that insurers have paid. They also distinguish rejection, turnaround time and payout adequacy. This is an international analytical framework, not a new Nigerian reporting rule or a standardised ranking of local companies.
We apply that distinction to questions a Nigerian household can ask when reading a report or considering a policy. We have not collected insurer-level comparable data. Therefore, none of the invented percentages below should be attached to a real company, a product or the Nigerian insurance market.
Start with the claim cohort and its open cases
Imagine 20 wholly fictional claims logged within one defined cohort. At a common cutoff, 15 have been paid, 3 rejected and 2 remain open. The categories add to 20. An open case is neither a completed payment nor a rejection simply because the reporting date has arrived.
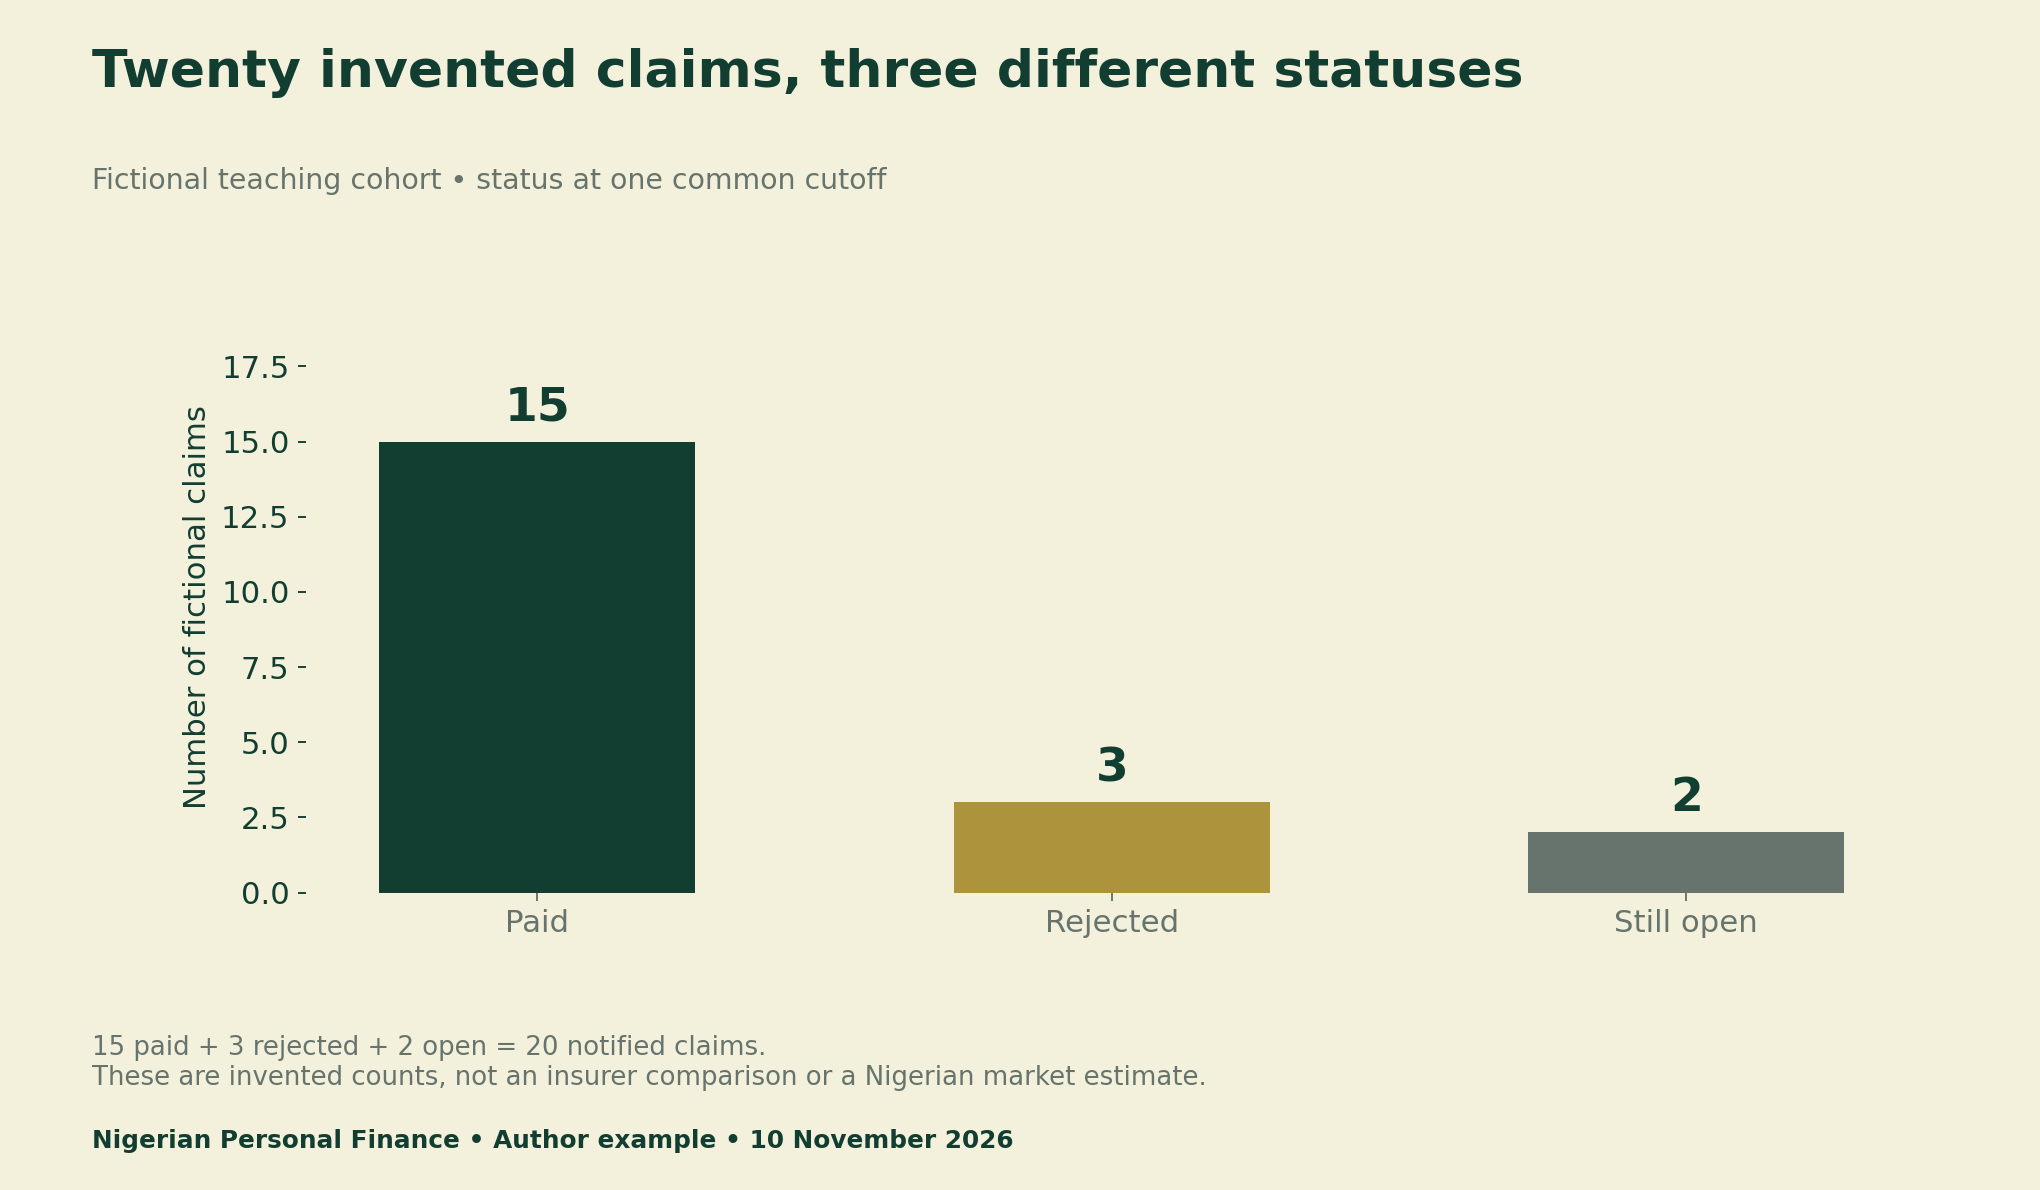
Before using a real disclosure, record whether it follows claims lodged during the period, claims decided during the period or an opening backlog plus new claims. Those groups can contain different cases. A calendar-year headline is not enough to establish that two companies used the same cohort.
Also check what “settled” means in that document. It may require closer reading than the word “paid.” Record the report’s actual definition rather than silently replacing it with your own. Missing definitions belong in an unresolved-question column, not in a calculation with an assumed answer.
Why an insurance claims settlement ratio can change
For the invented cohort, paid claims divided by all notified claims gives 15÷ 20×100=75%. If someone instead divides paid claims by the 18 decided cases, the result is 15÷ 18×100=83.33%. No claim has changed status. Only the denominator changes, because the second calculation leaves out the 2 open cases.
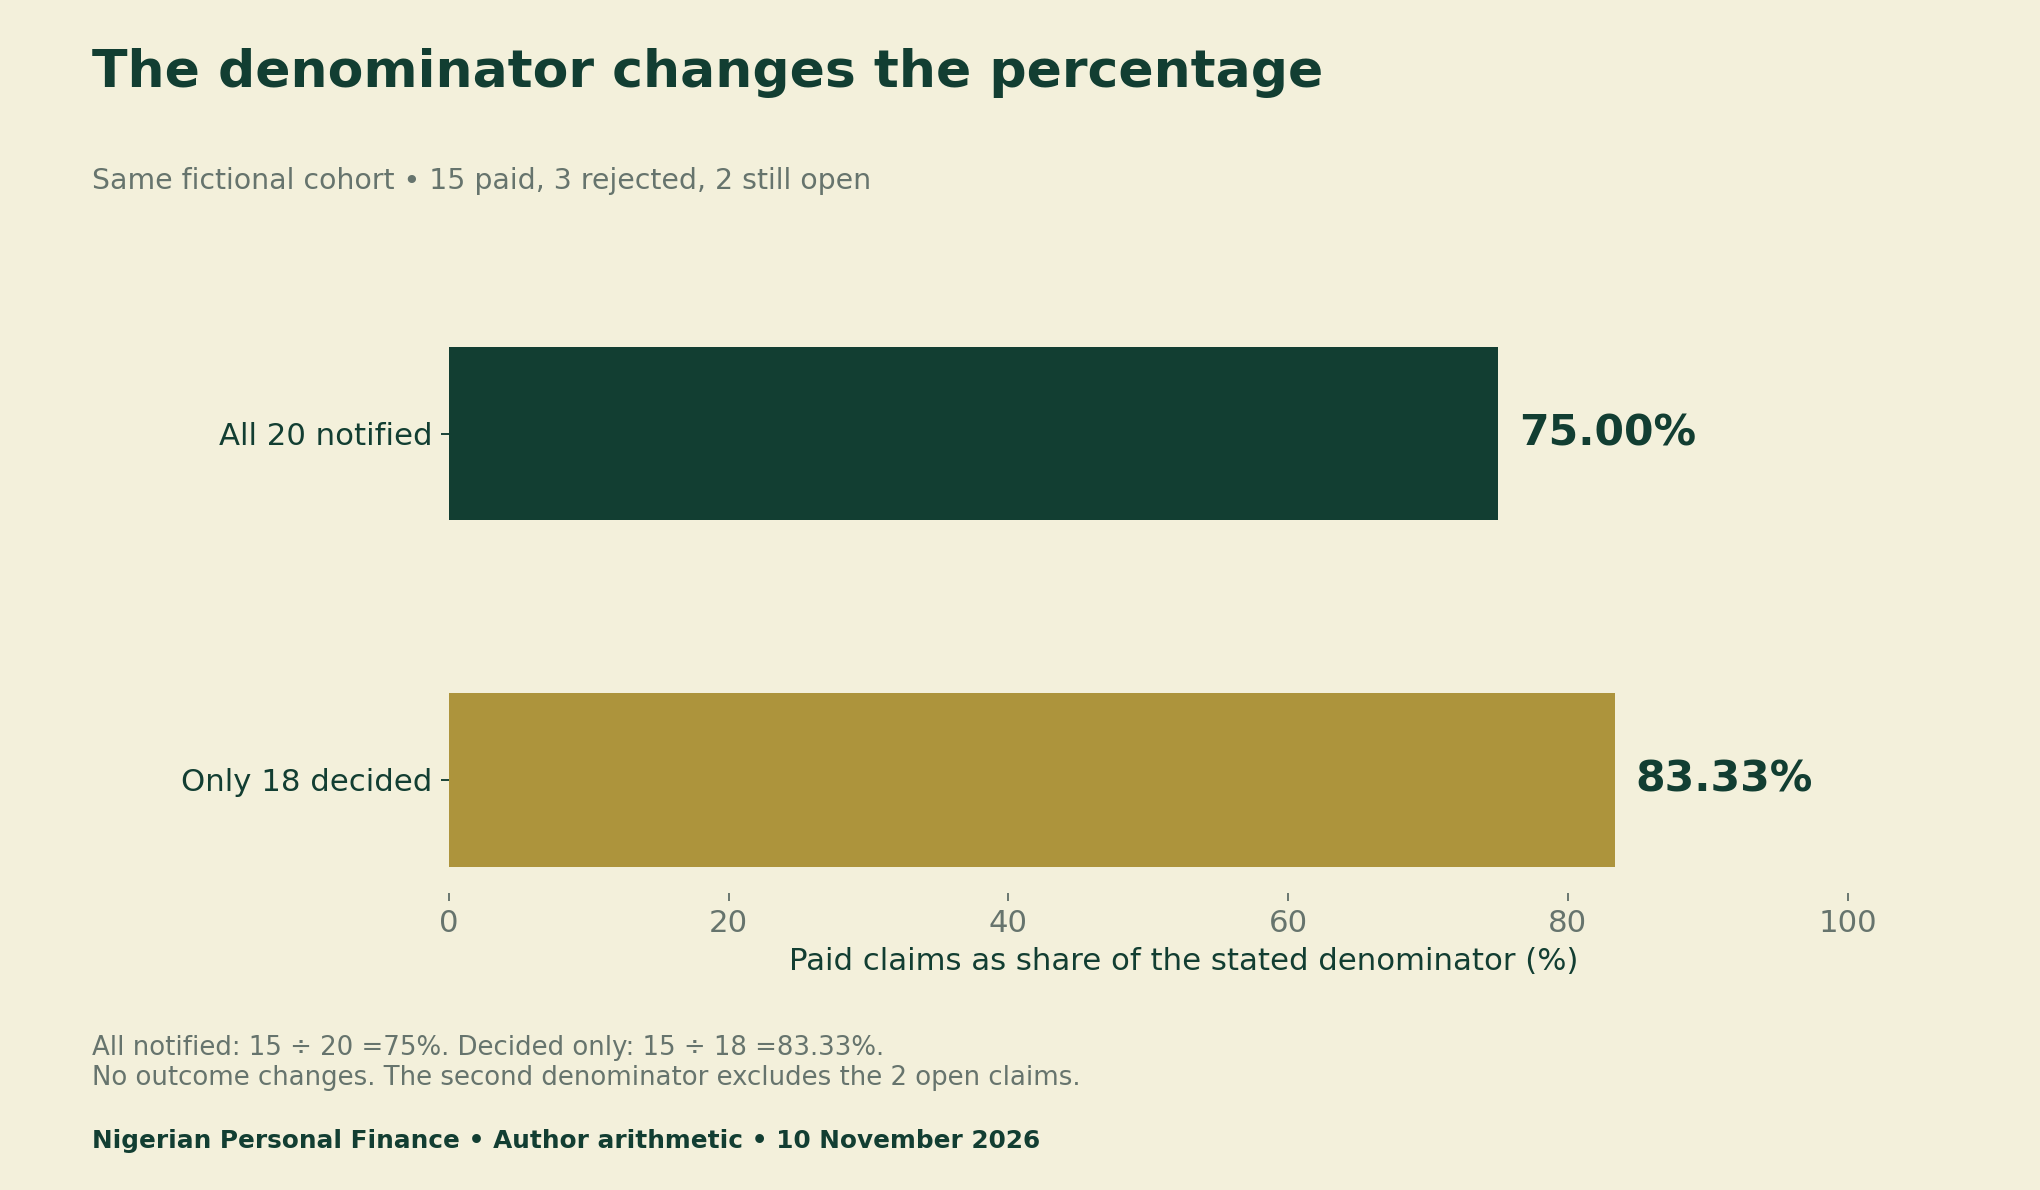
Use this distinction when searching for an insurance claims settlement ratio Nigeria comparison. Do not select the larger percentage without its definition. A useful citation includes the numerator, denominator, product, cohort, cutoff and source location. Without those details, a precise-looking number can still be unsuitable for comparison.
Nor is75% an individual policyholder’s approval probability. The fictional cohort says nothing about a reader’s coverage, exclusions, evidence or eligibility. A historical aggregate from a real report would also require careful interpretation. It cannot replace the actual policy wording and the facts of a claim.
Keep claim-count ratios separate from money ratios
Consider a separate invented cash example: an insurer pays ₦800,000 in claims and receives ₦2 million in premiums during a specified window. Cash paid divided by premiums received is 40%. That is an amount-based comparison. It does not mean40% of claims were approved or that each customer received40% of a loss.
Do not label that simple cash ratio an actuarial loss ratio. Measures using incurred claims, earned premiums, reserves or different accounting periods need their own definitions. Large and small claims also carry different cash weights. Record the unit before interpreting a percentage: a claim count and a naira amount are not interchangeable.
A quick payout average can hide open claims
A second fictional example follows four claims lodged on day 0. A is paid on day 4 and B on day 8. C and D are still open at the common day 30 cutoff. The completed-only average is(4+8)÷2=6 days. However, the two unresolved cases have already been open for 30 days each.
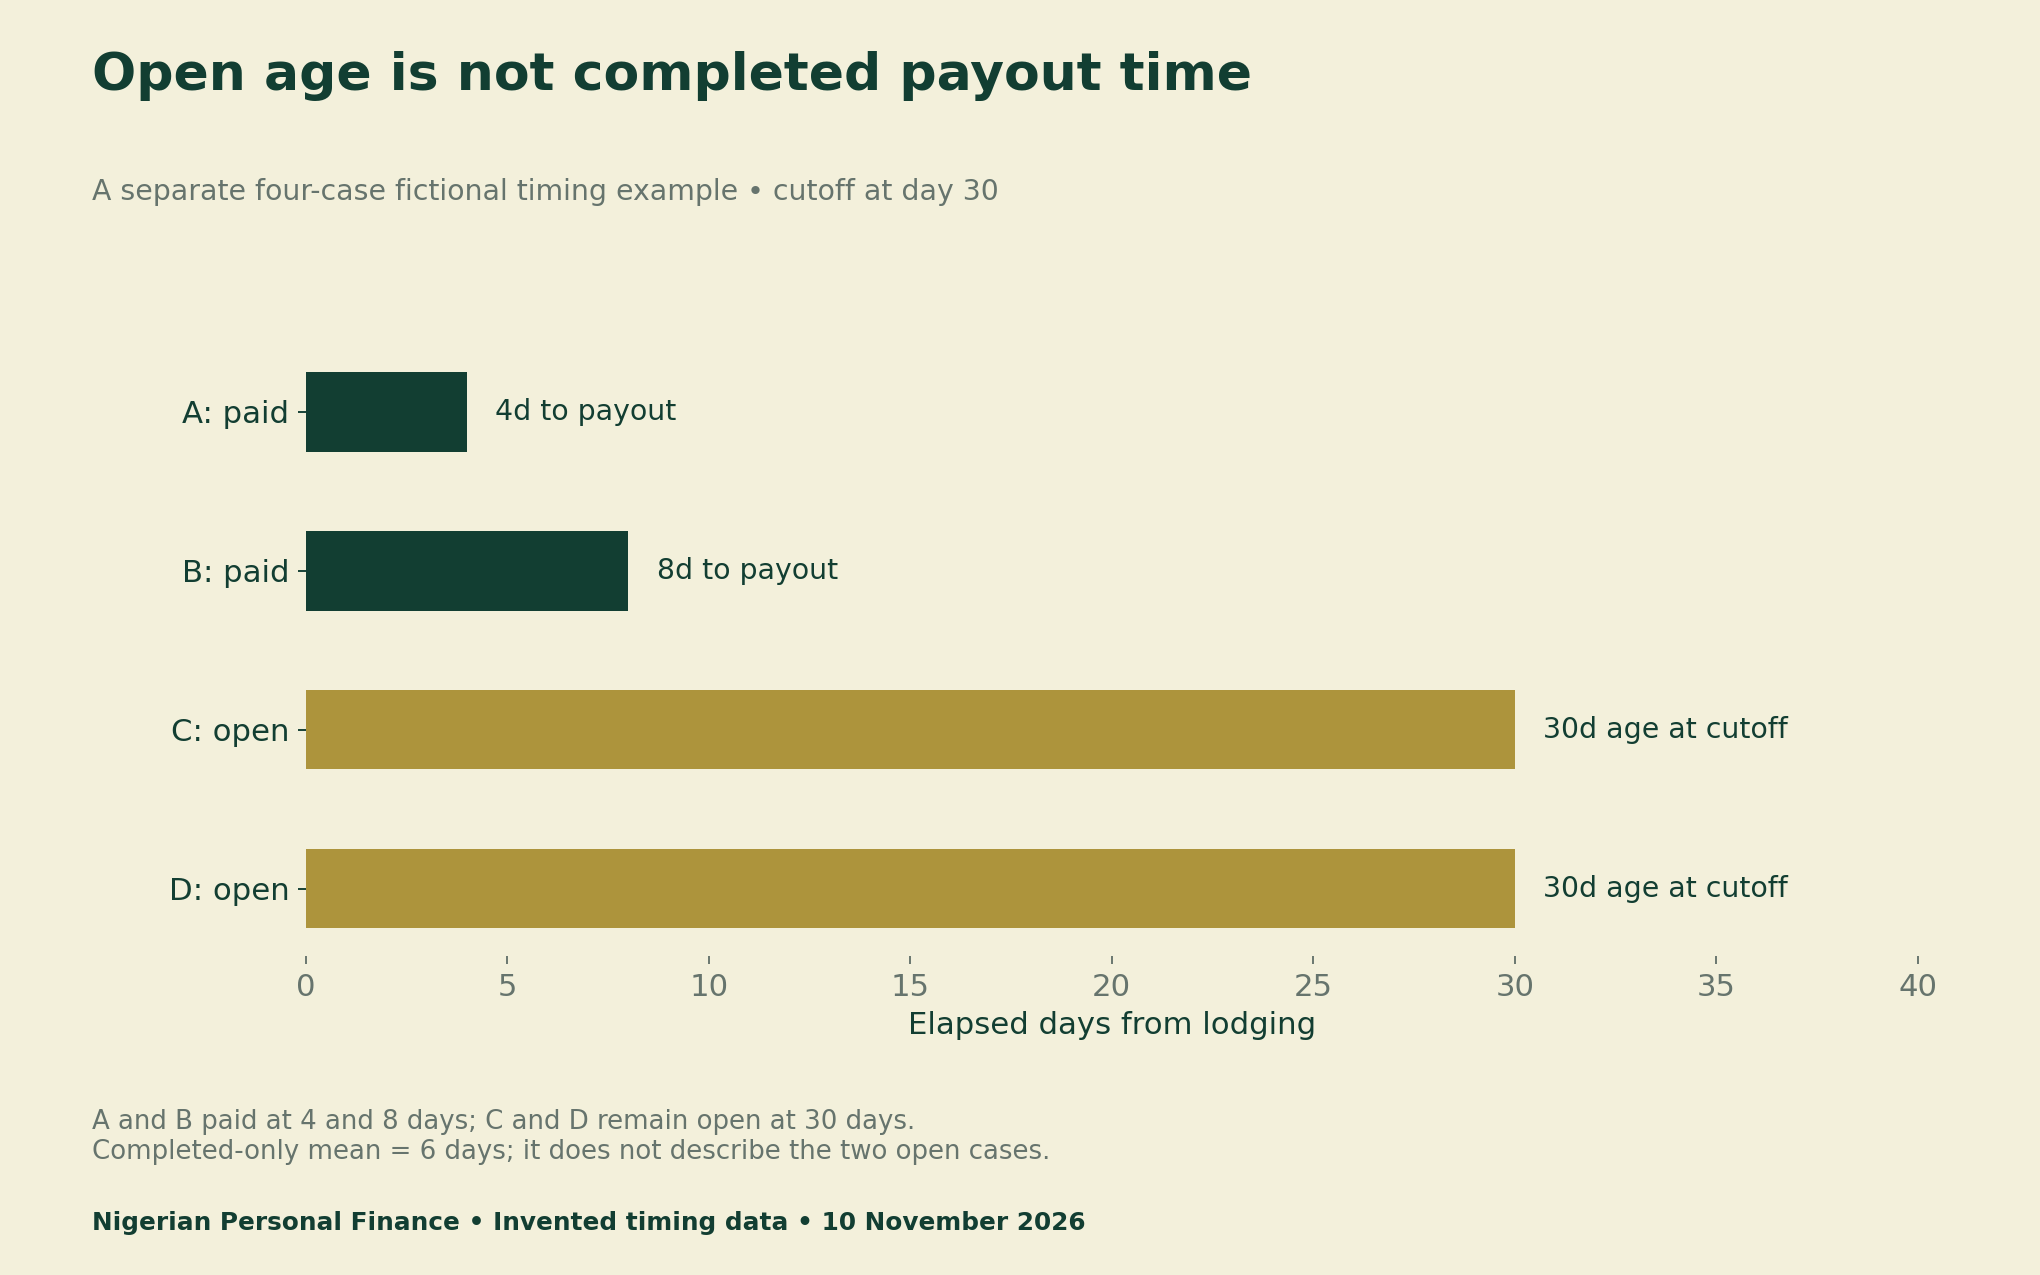
An open claim does not have a zero-day turnaround. Its final payout time is not yet observed. Ask for the starting event, the ending event, the treatment of incomplete files and the age of outstanding cases. Avoid using a completed-only mean as if it described everyone who lodged a claim.
Your Personalized Financial Plan
Get expert financial advice tailored exclusively to your goals. Receive a custom roadmap in just 1-3 business days.
Get StartedLikewise, a short administrative processing time may start after documents become complete, while the household has been waiting since lodging. Those clocks answer different questions. Preserve the source’s time origin. The paper’s indicator notes use lodging to payout; a disclosure using another clock needs that difference stated.
A paid claim still needs a value and timing check
A payout can be counted as paid yet arrive too late for a household’s urgent bill. It can also be small relative to the insured loss or need. The paper treats payout adequacy and cash-flow timing as customer-value questions, with survey evidence complementing administrative counts. A settlement percentage alone cannot establish those outcomes.
For your own records, ask what was covered, what excess or limit applied, when the claim was lodged and when cash arrived. Keep medical documents, policy numbers and personal claim evidence private. Our blank tool is a local worksheet; the website does not ask you to upload sensitive documents.
Our guide to checking payment-protection claims uses a related evidence principle: a regulatory statement and a verified product arrangement are different things. For insurance, keep the measurement paper, an insurer’s disclosure and your actual policy separate too.
Download the disclosure audit and worked examples
Use the definition register beside the original publication. The denominator file reproduces both fictional count ratios and the separate cash example. The timing file retains completed times and open ages in distinct fields. The blank audit helps you record missing definitions instead of inventing comparable data.
- Insurance metric definition register (CSV)
- Fictional claims denominator calculations (CSV)
- Fictional payout-time and open-age audit (CSV)
- Blank insurer disclosure audit (CSV)
Method, limitations and update log
Research checked 10 November 2026. The source is the joint CGAP–IAIS–UNSGSA paper announced on 3 November. We retained its 29-page PDF and checked the indicator table on PDF pages 17–18, printed pages 15–16. The calculations are original teaching examples. No insurer ranking, customer survey or Nigerian market-performance estimate was produced.
All percentages are rounded only after division. The 20-claim cohort, four-case timeline and cash example are separate inventions and must not be joined as real observations. Suggested citation: Nigerian Personal Finance, “Insurance Claims Ratios in Nigeria: What Do They Measure?”, 10 November 2026. Cite the joint paper for indicator definitions and this report for the reproducible examples.


