






Nigeria grocery prices and global food prices answer different questions. A falling international index does not mean the same food basket in your Nigerian shop must cost less. Your bill also changes when quantities, pack sizes, quality or outlets change. A useful comparison holds those choices steady before calculating the price difference.
This report uses FAO’s 6 November release for global context, then builds a private household measurement method. It contains two charts, a two-ledger infographic and four free CSV tools. No Nigerian retail-price survey was conducted. Every naira price in the worked examples is fictional, rather than a quotation from a current market.
What the November FAO release actually measures
The FAO release dated 6 November reports an October 2026 Food Price Index of 133.9 points. It states a 1.2% monthly decline and a 5.9% annual increase. These are international traded-food commodity measures. The monthly and annual figures use different comparison dates, so a fall from September can coexist with an increase from the previous October.
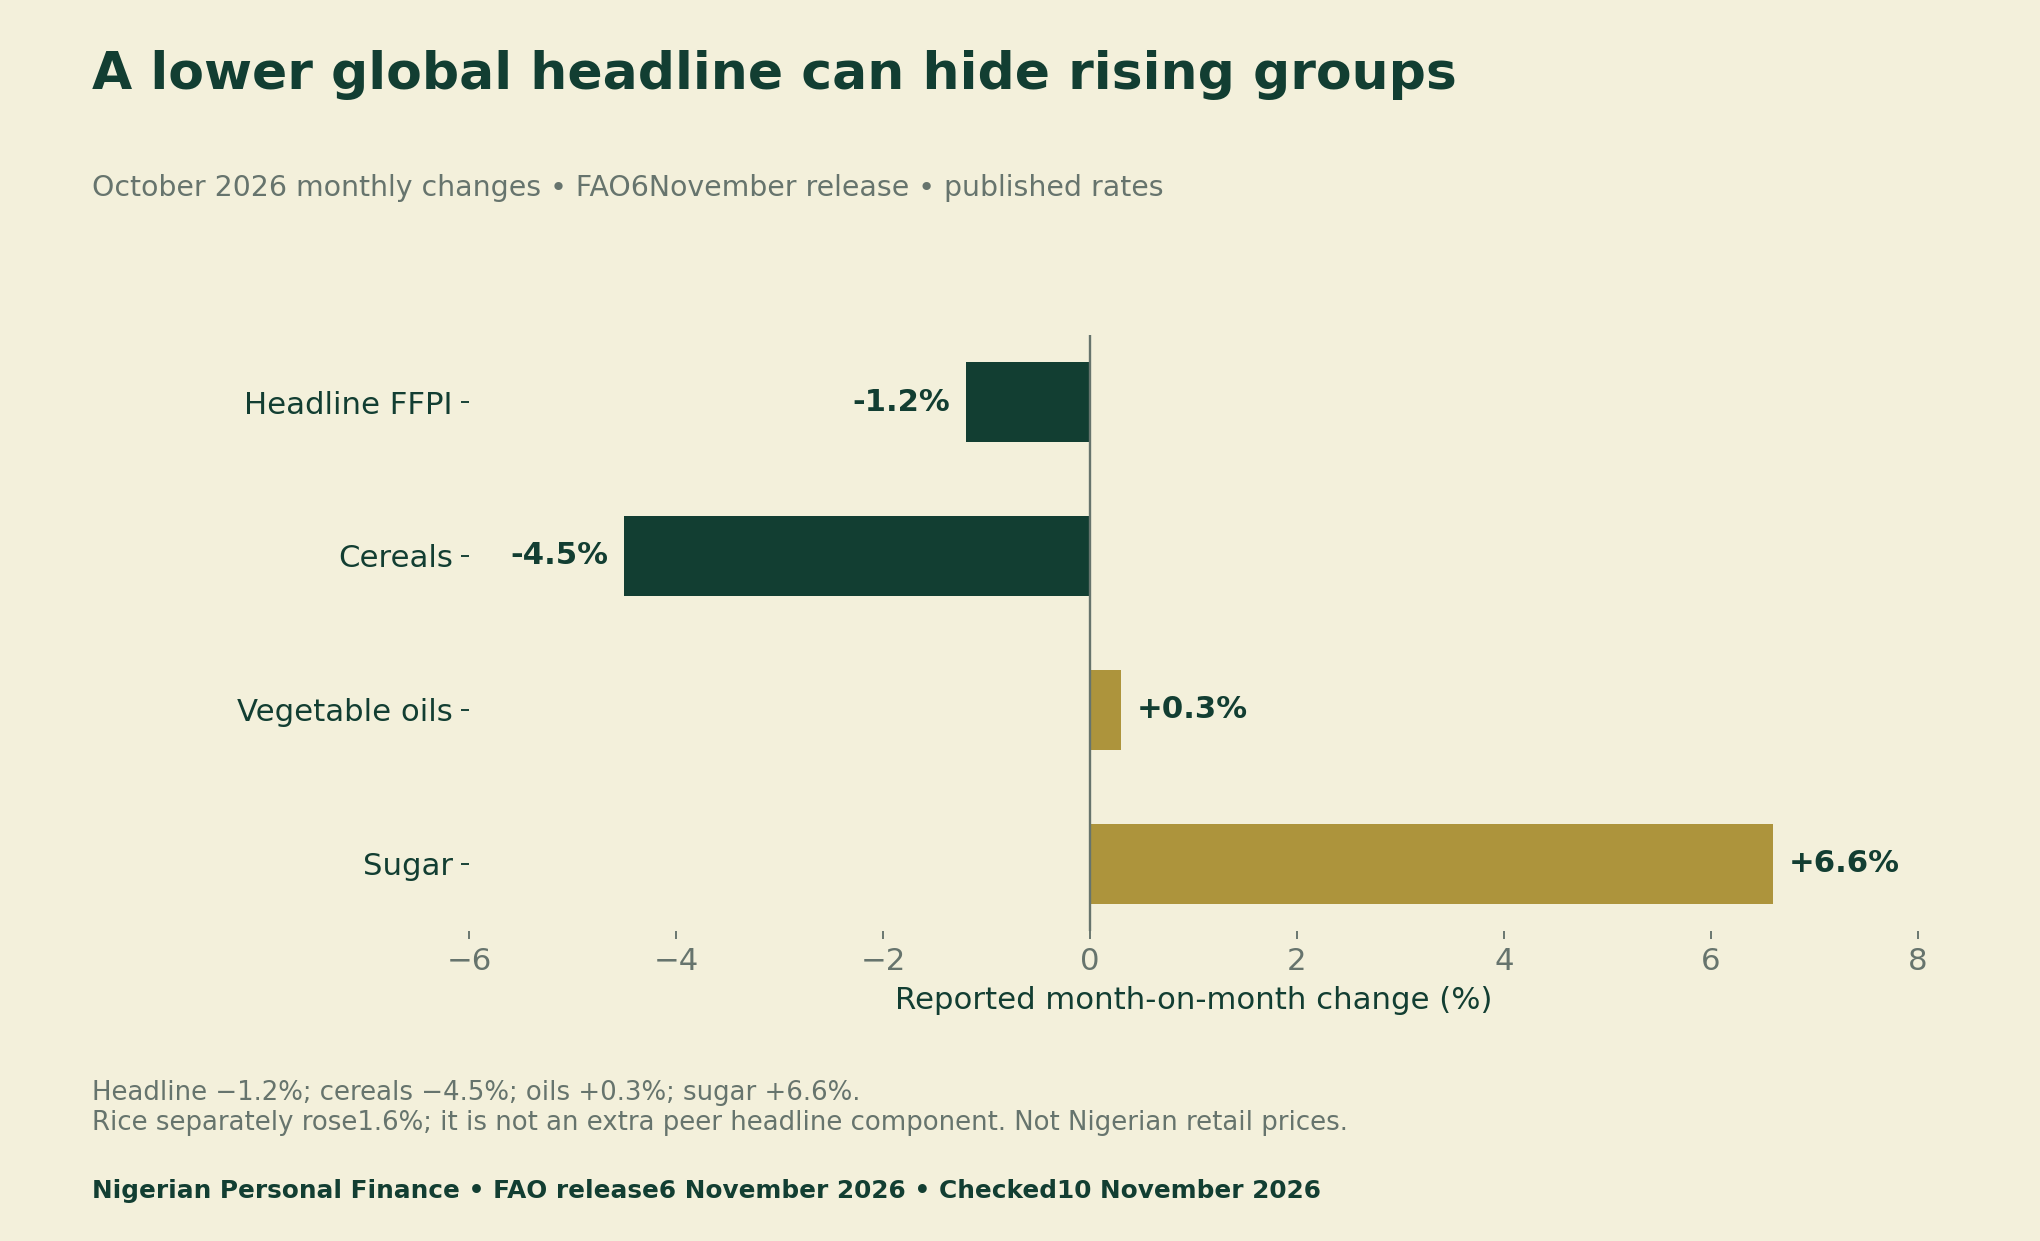
The broad cereal index fell, while vegetable oils and sugar rose. The separate rice sub-index also increased. Therefore, even the international headline does not describe every food moving in one direction. A household buying particular rice, oil or vegetables has a different basket, currency, supply chain and purchasing pattern.
Use one release vintage when comparing months. The same-vintage official downloadable CSV lists rounded headline levels of 135.6 for September and 133.9 for October. Those displayed levels imply about −1.25%, whereas the release reports −1.2%. We preserve the reported rate in Figure 1 and flag this small inconsistency. We do not silently replace it or splice in the earlier release’s September figure.
Why a Nigerian shopping bill is a different measure
International quotations and local shelf prices have different units and coverage. Currency conversion, transport, local supply, storage and retail margins can affect transmission. However, this desk research does not estimate each factor’s contribution to a Nigerian price change. A plausible explanation is not a measured causal result.
Your own expenditure also mixes prices and decisions. Buying an extra kilogram raises spending even if the kilogram price is unchanged. Switching shops may change price and travel cost together. Dropping an unavailable product may lower the bill while making the basket less comparable. Keep these changes visible before deciding what the total means.
The practical question is narrower: what would buying the same specified quantities cost at the two observation dates? That fixed-basket question helps you distinguish a price comparison from a change in consumption. It does not replace national consumer-price statistics or describe every household in your town.
Match the product, quantity and outlet first
Choose a manageable basket of foods your household actually buys. Write a clear product specification, brand or grade, pack quantity and unit. Record the observation date, town and outlet reference. Then revisit the same specified items at the same outlets, preferably about four weeks later. Report the actual interval rather than calling every comparison monthly.
Convert comparable pack prices to naira per kilogram or litre. Keep grams and kilograms, or millilitres and litres, consistent. Do not compare different grades as if they were identical products. If a loose measure is not reliably weighed, record that limitation instead of giving an unjustifiably precise unit price.
No reader needs to publish a private household’s shopping pattern. Use local references rather than names or personal addresses in the template. We do not collect completed baskets, receipts or financial details. A community study would need its own documented sampling and privacy method before any public claim about local prices.
A cheaper pack can have a higher unit price
Consider the same product at wholly fictional prices. One1kg pack costs ₦2,000, so its unit price is ₦2,000/kg. A 900 g pack costs ₦1,900. Divide by 0.9 kg to get about ₦2,111.11/kg. The displayed pack costs 5% less, while the price per kilogram is5.56% higher.
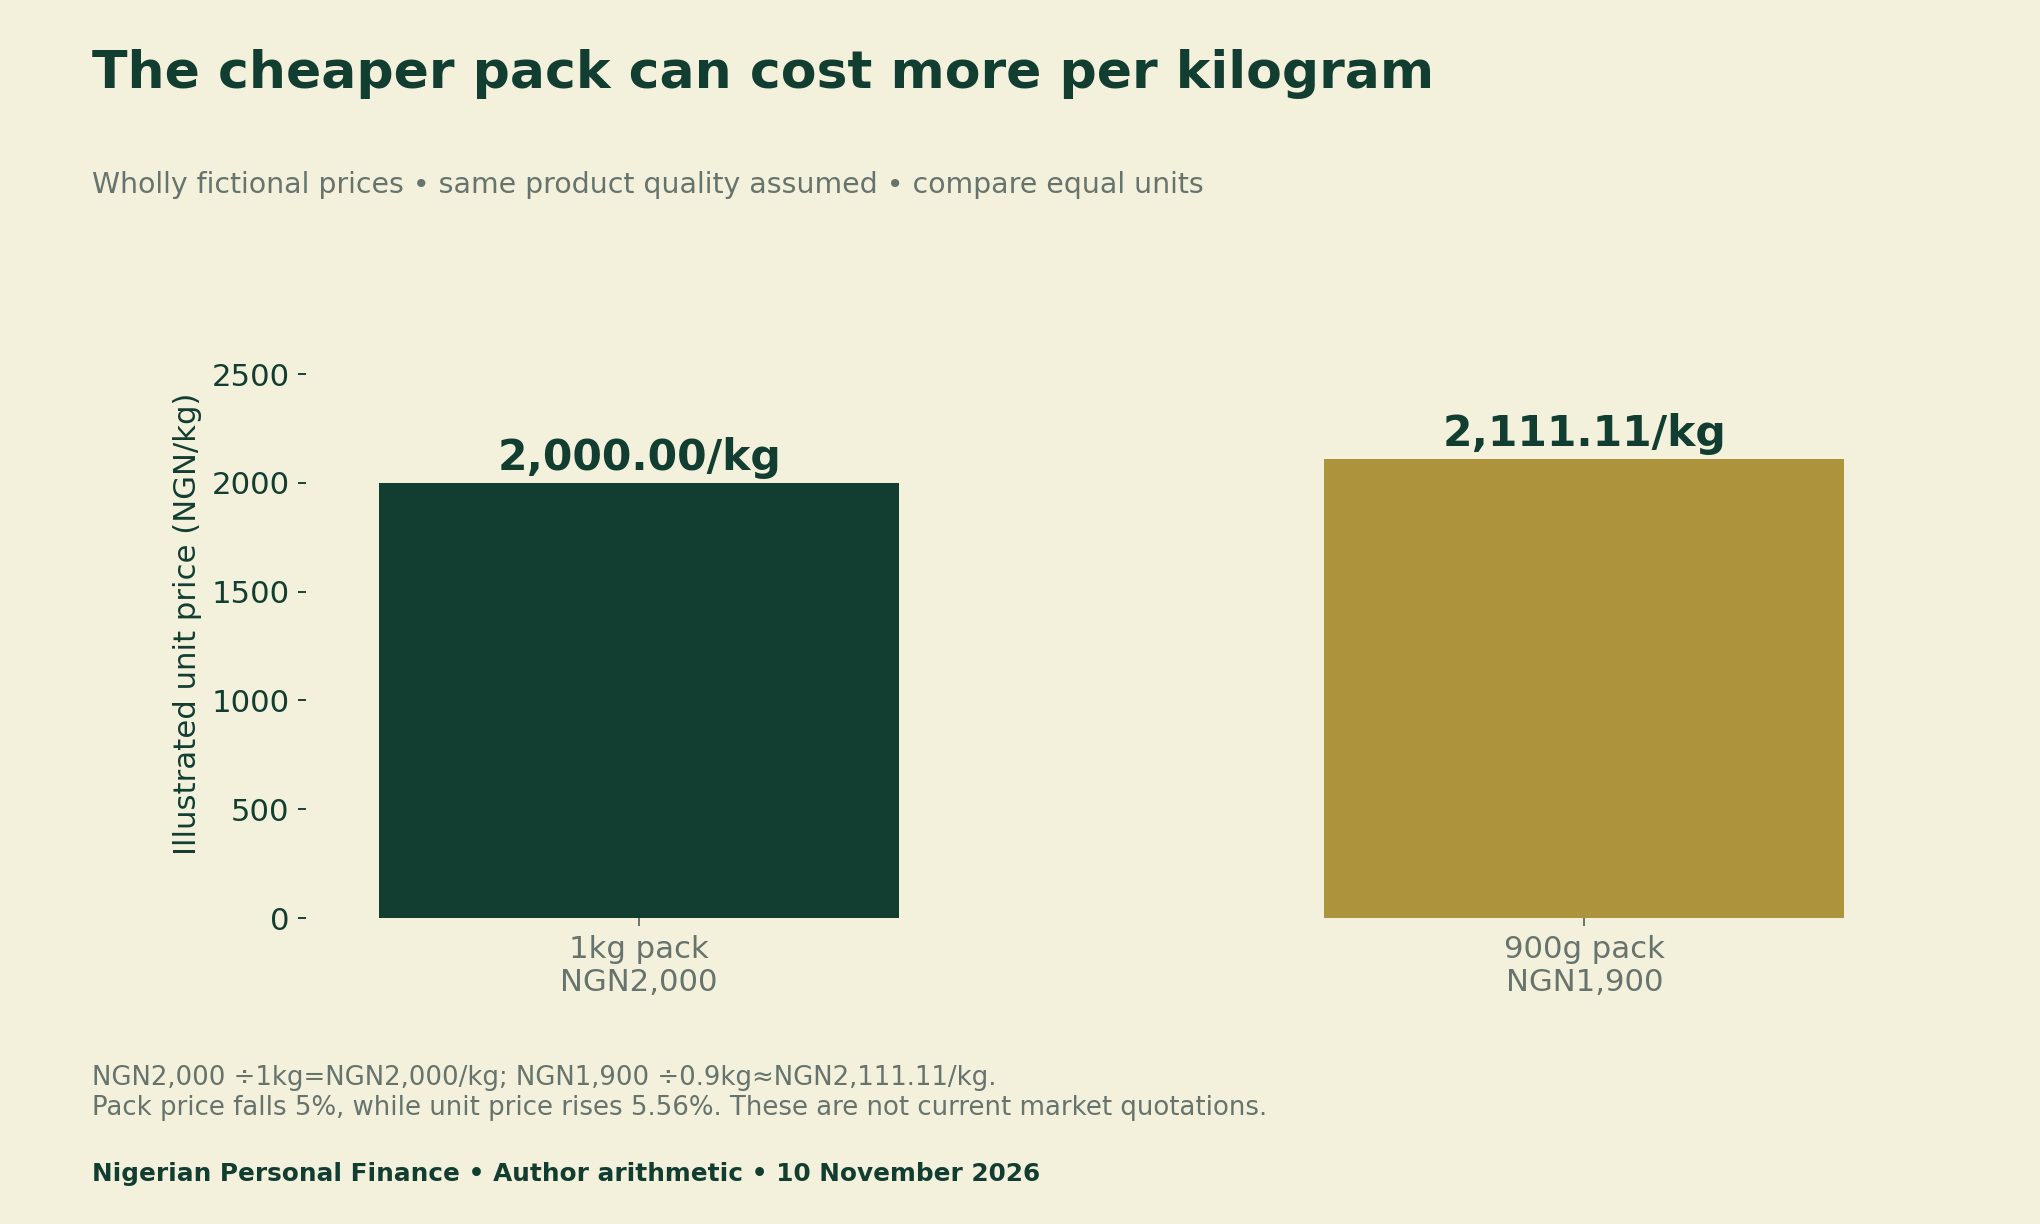
The smaller pack may still suit a family’s immediate cash limit. A lower unit price does not make a large purchase affordable. Consider storage, spoilage, cooking needs and transport as well. Do not sacrifice safe food handling or a family member’s dietary needs simply to improve the spreadsheet result.
Calculate the fixed-basket change with base quantities
For each matched item, multiply the current unit price by the quantity in the original basket. Add those current-price costs. Divide by the cost of the same quantities at the first observation, then subtract one. Multiply by 100 to express the result as a percentage. Keep the base quantities unchanged throughout this comparison.
In a fictional example, a fixed basket costs ₦15,000 at the first observation and ₦16,000 at the second. The change is (16,000 ÷ 15,000 − 1) × 100 = 6.67%. That is a calculation about the invented basket. It is not measured Nigerian food inflation or evidence that every household faced that increase.
Your Personalized Financial Plan
Get expert financial advice tailored exclusively to your goals. Receive a custom roadmap in just 1-3 business days.
Get StartedThe calculation needs a positive base cost and enough matched observations. If a required price is missing, do not turn the blank into zero. Flag the incomplete match and explain what remains comparable. Any partial-basket result must identify its included items and limitation; it cannot quietly stand for the original full basket.
Keep actual spending in a second ledger
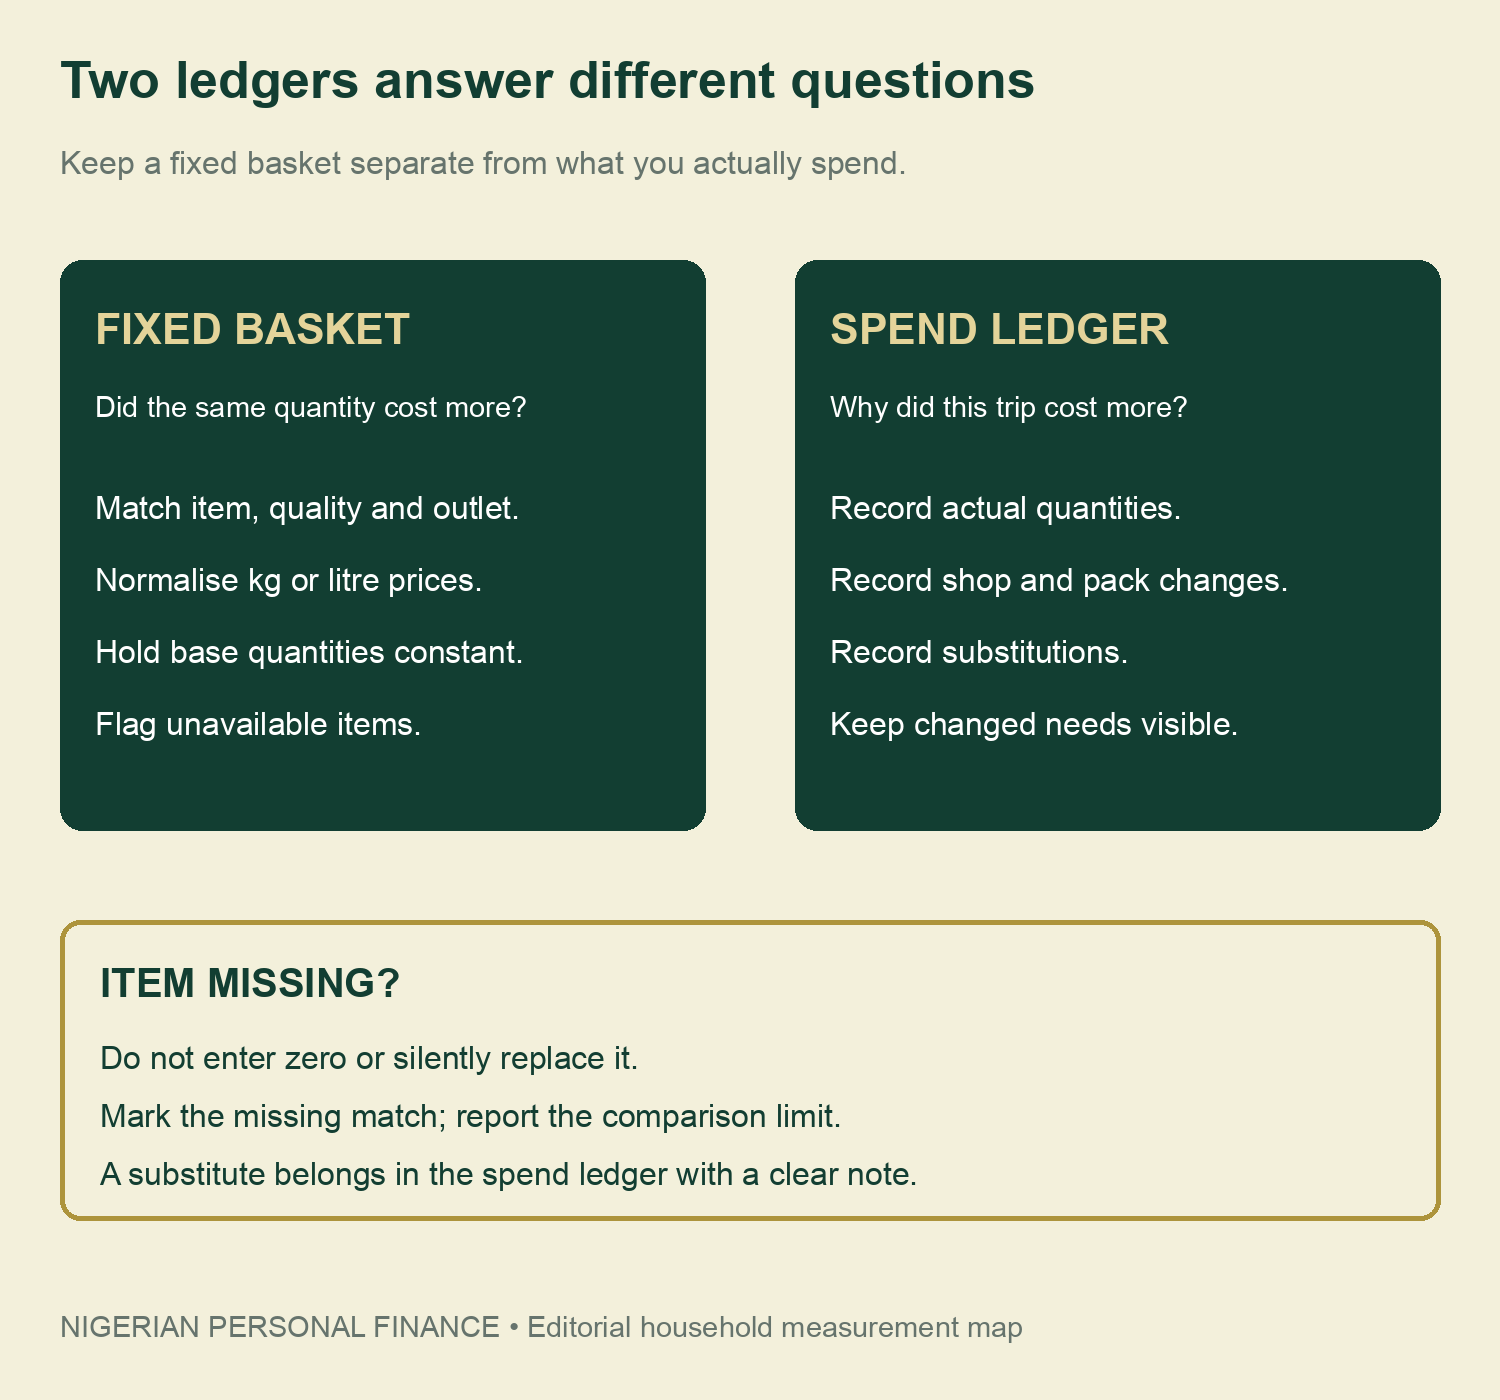
Use the spend ledger for what happened on each trip. Record extra quantities, substitutions, pack changes and unavailable items. A replacement may be sensible for the family while breaking the fixed comparison. Note both facts. This makes the record more useful than forcing every shopping decision into one inflation number.
If spending rises because a household member’s needs change, describe that as a quantity or mix change. Likewise, a new outlet may offer a lower price but require extra transport. Keep the food-price calculation separate from the full trip budget. The worksheet does not estimate which choice is best for your particular family.
Use the result for a practical budgeting conversation
Start with the largest verified changes in the matched items. Check whether the observations are genuinely comparable before acting. A repeat visit or a pack-size correction may explain an apparent jump. If the price difference survives those checks, consider the household’s cash, storage and nutrition constraints together.
Our emergency-access guide for digital savings addresses whether money is available before a bill is due. That is a separate cash-timing question. A grocery basket can become harder to fund because prices rose, because income arrived later, or both; one worksheet should not erase the other distinction.
Download the source extract and private tools
The global extract preserves release dates, source links and the reported-versus-rounded distinction. The arithmetic file labels every invented input. Use the two blank ledgers for your own observations. They contain no prefilled Nigerian market sample and no automatic claim to represent a town or country.
- FAO October 2026 source extract (CSV)
- Fictional basket and pack arithmetic (CSV)
- Blank fixed grocery basket (CSV)
- Blank spending and changes ledger (CSV)
Method and update log
Research checked 10 November 2026. FAO’s 6 November release provides the October global context; its downloadable series was retained from the same check. Figure 1 reproduces selected published monthly rates, with the rice sub-index kept separate. Figure 2 and the basket example use author-created fictional arithmetic. No local price observations, causal decomposition or national inflation estimate are claimed.
Suggested citation: Nigerian Personal Finance, “Why Your Nigerian Grocery Bill Can Rise When Global Food Prices Fall,” 10 November 2026. Cite FAO for the commodity measures and this report for the original measurement templates. Future observations should retain their dates, specifications and missing-item notes rather than overwrite the earlier record.


