




Small business loan repayment cash flow in Nigeria needs a calendar, not just a sales target. Higher receipts can still leave little for the next stock purchase or a household bill. This report separates a recent study’s findings from an original, fictional cash model. You can change the assumptions in the downloadable tools.
The main result is simple. Our invented shop collects ₦600,000 in a month but retains only ₦15,000 after four cash outflows. A 20% receipts fall turns that result into a ₦27,000 shortfall, even when stock payments fall in proportion. Those figures illustrate a planning problem. They are not estimates of Nigerian businesses’ typical margins.
What the productive-credit research actually covers
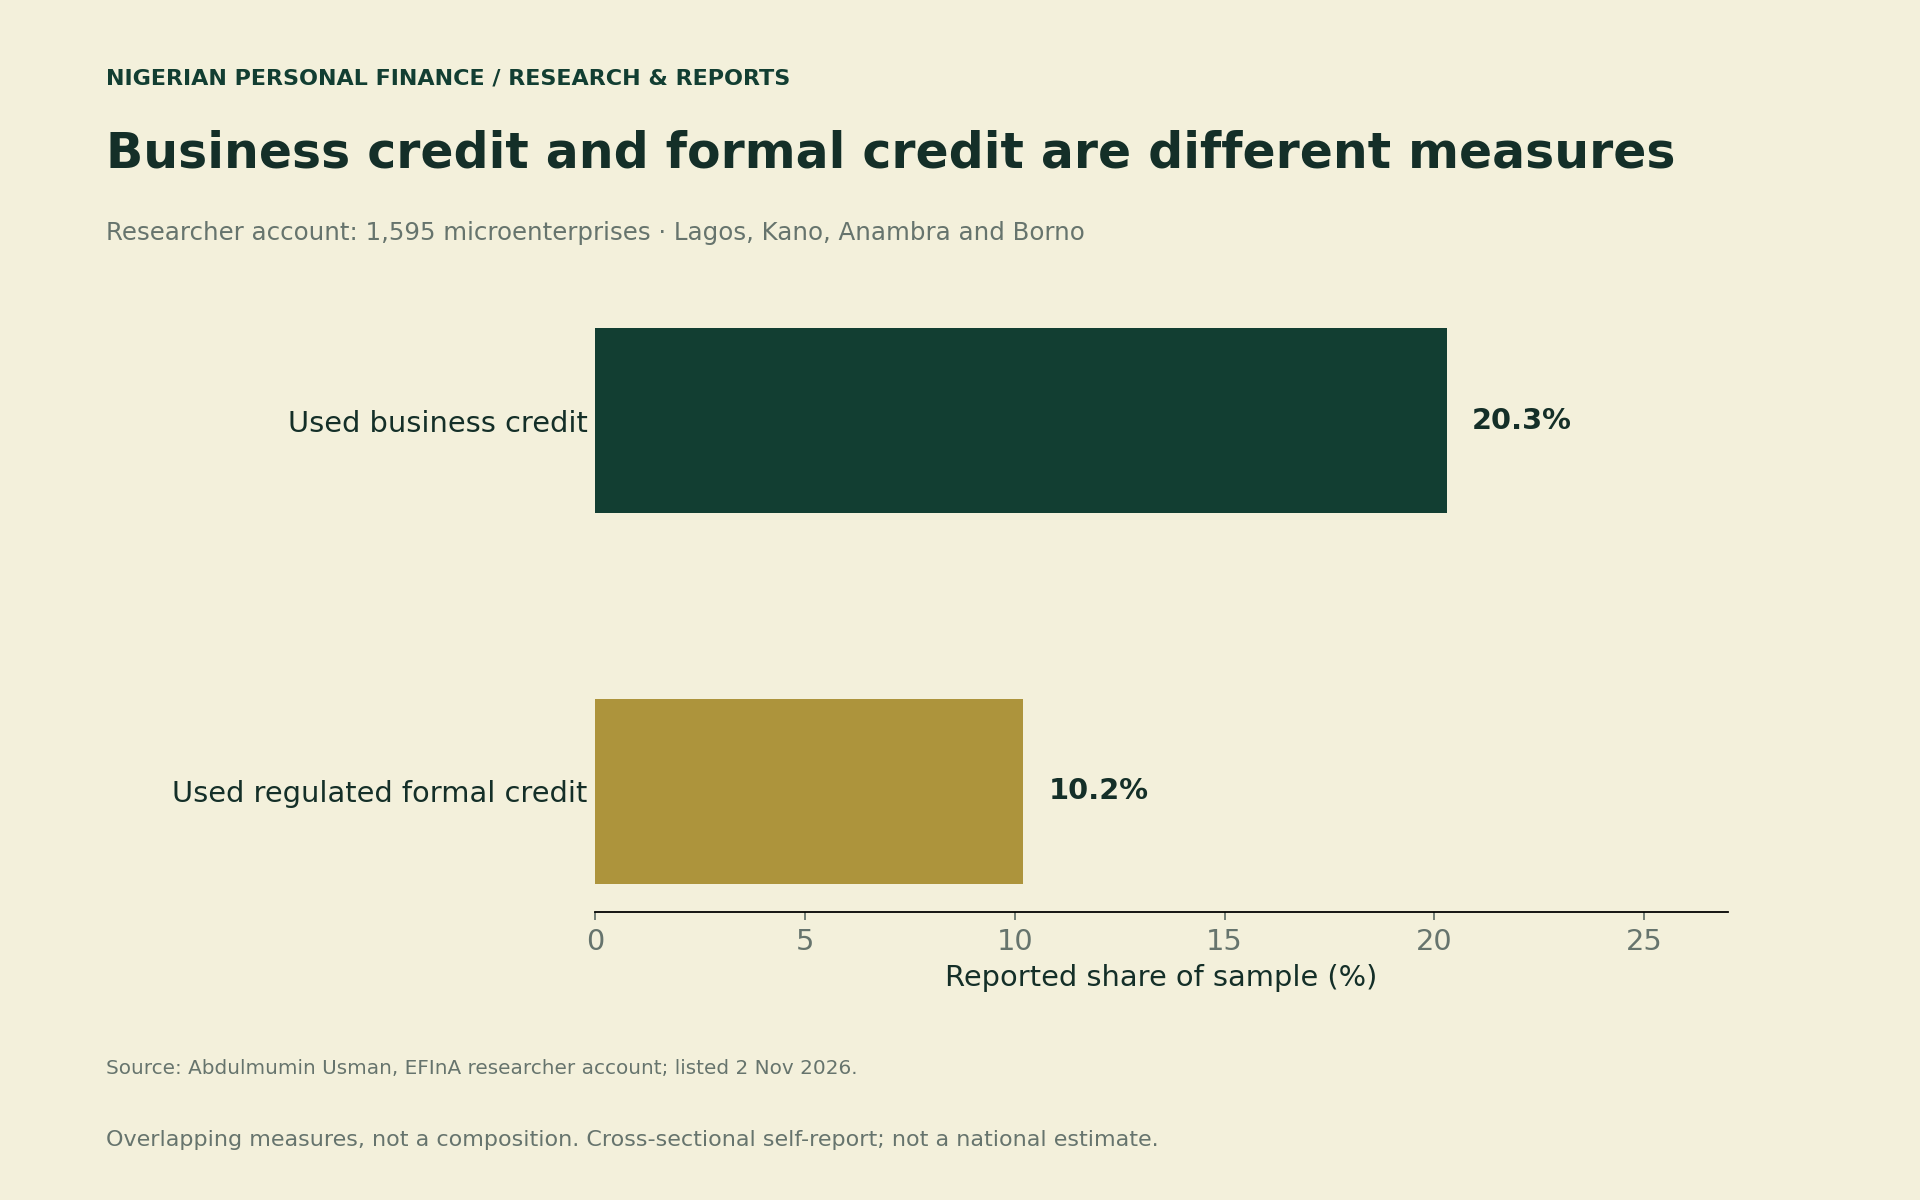
Abdulmumin Usman’s EFInA researcher account was listed on 2 November 2026. His original account appeared on 30 October. It describes 1,595 microenterprises across 12 local government areas and commercial clusters in Lagos, Kano, Anambra and Borno.
The account reports business-credit use of 20.3% and regulated formal-credit use of 10.2%. These measures overlap; do not add them. They refer to this sample, not every Nigerian business. The source does not establish exact fieldwork dates, so November is the publication timing, not a fieldwork label.
A separate subset contains 208 borrowers with complete growth information. Within it, 60.1% reported turnover or restocking growth without hiring; 18.8% reported growth including additional workers. These selected categories do not form a complete breakdown. More importantly, the smaller denominator cannot stand in for all 1,595 enterprises.
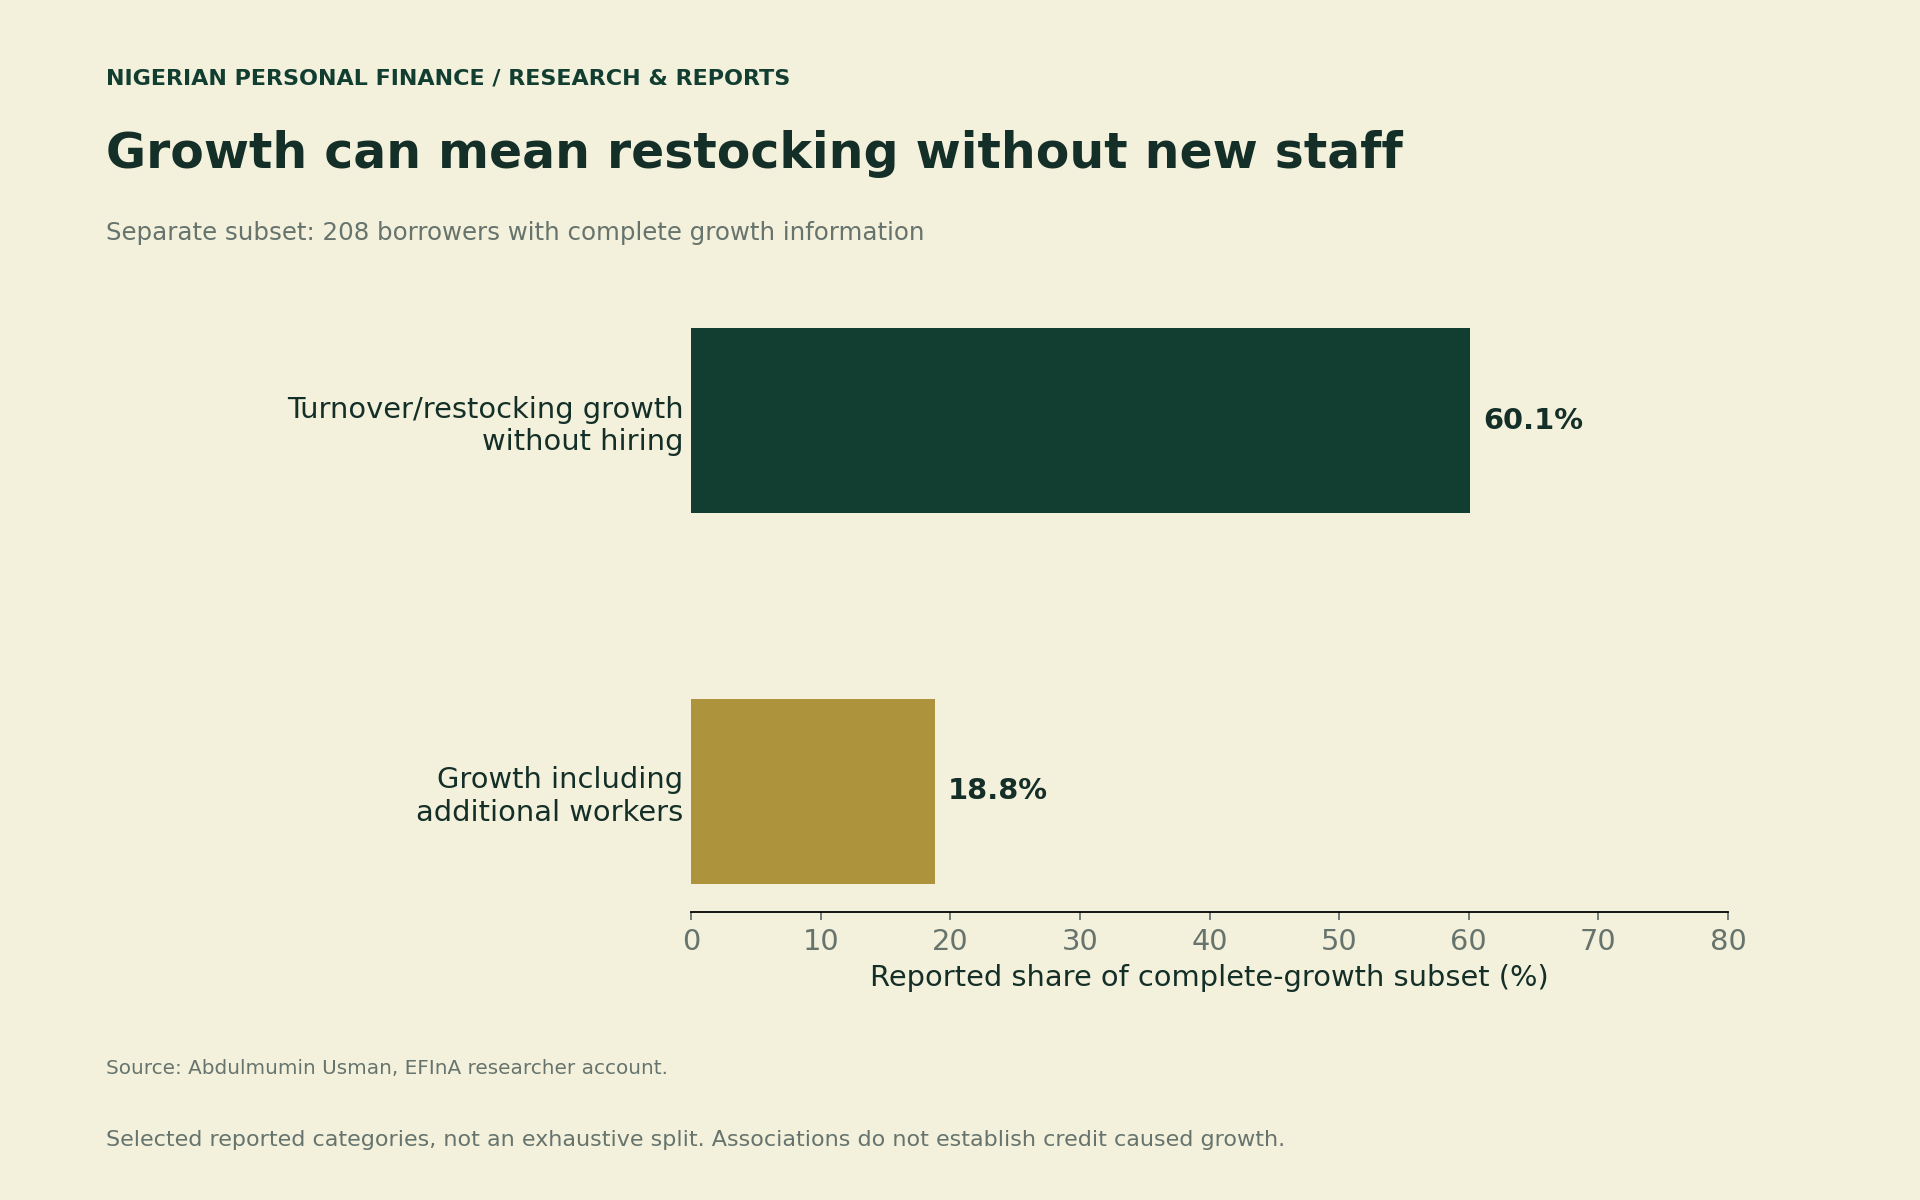
The study is cross-sectional and self-reported. Women are underrepresented in its Kano and Borno samples. It shows associations, not proof that borrowing caused growth. We do not merge it with EFInA’s separate national Access to Financial Services survey. Nor do we infer an individual borrower’s likely outcome from these percentages.
A small business loan repayment cash flow example
Now leave the survey behind. Imagine a shop that collects ₦600,000 this month. It pays ₦390,000 for stock, ₦60,000 for operations and ₦75,000 in debt service. The owner also withdraws ₦60,000 for household needs. Every amount is invented.
| Cash item | Fictional monthly amount | Treatment |
|---|---|---|
| Collected receipts | ₦600,000 | Cash in, not unpaid sales |
| Stock payments | ₦390,000 | Cash out |
| Operating payments | ₦60,000 | Cash out |
| Debt service | ₦75,000 | Cash out, assumed combined payment |
| Household withdrawal | ₦60,000 | Cash out of the business |
| Change in cash | ₦15,000 | Before tax, capital spending and omitted flows |
The calculation is ₦600,000 − ₦390,000 − ₦60,000 − ₦75,000 − ₦60,000 = ₦15,000. That remainder is a change in cash under our assumptions. It is not accounting profit. Principal repayments, stock timing, inventory on hand and household withdrawals need different treatment in formal accounts.
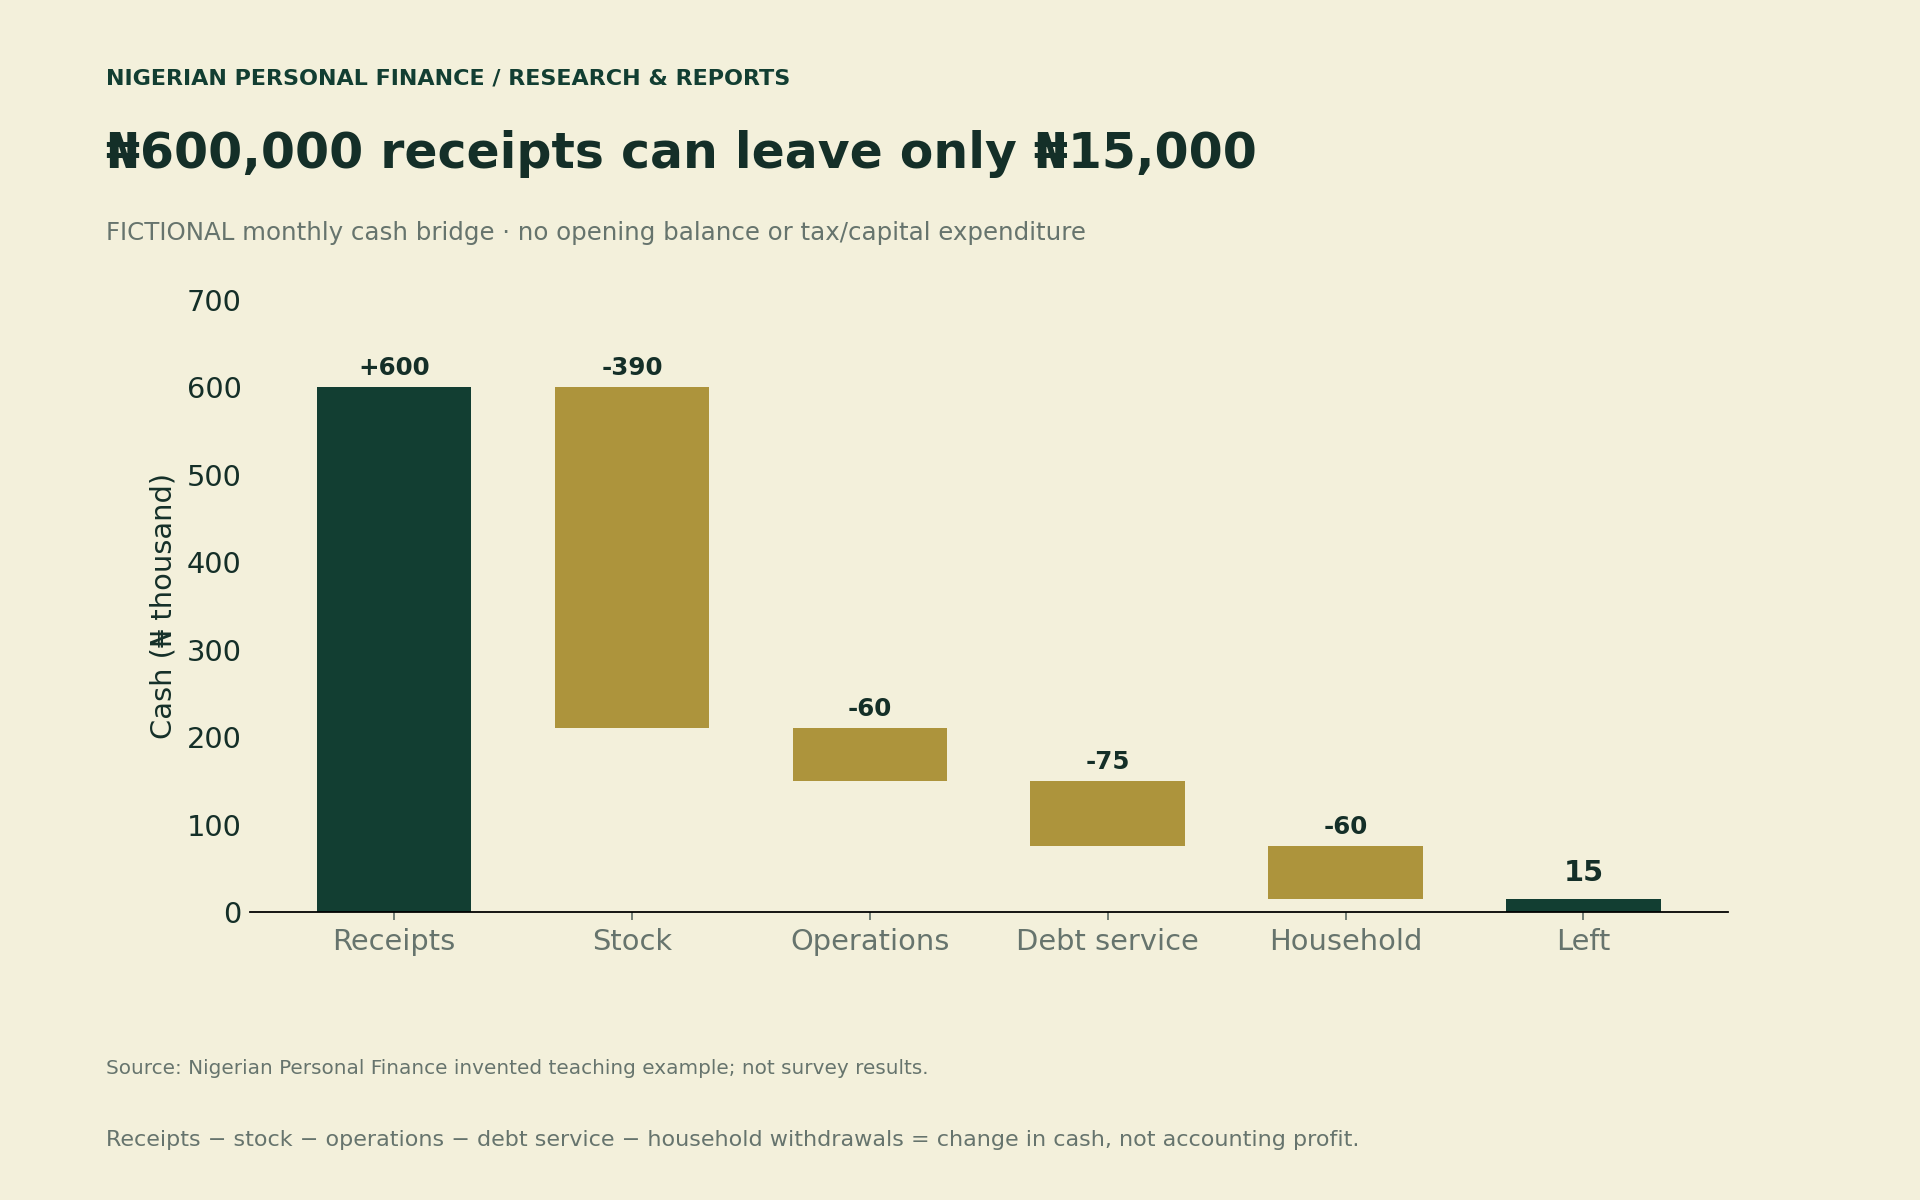
Also, this model excludes new borrowing as income. A loan drawdown can raise the bank balance while creating a future obligation. Keep it on a separate financing line. Otherwise, borrowed money can make a weak trading month look stronger than it was.
Test a poor month before relying on the remainder
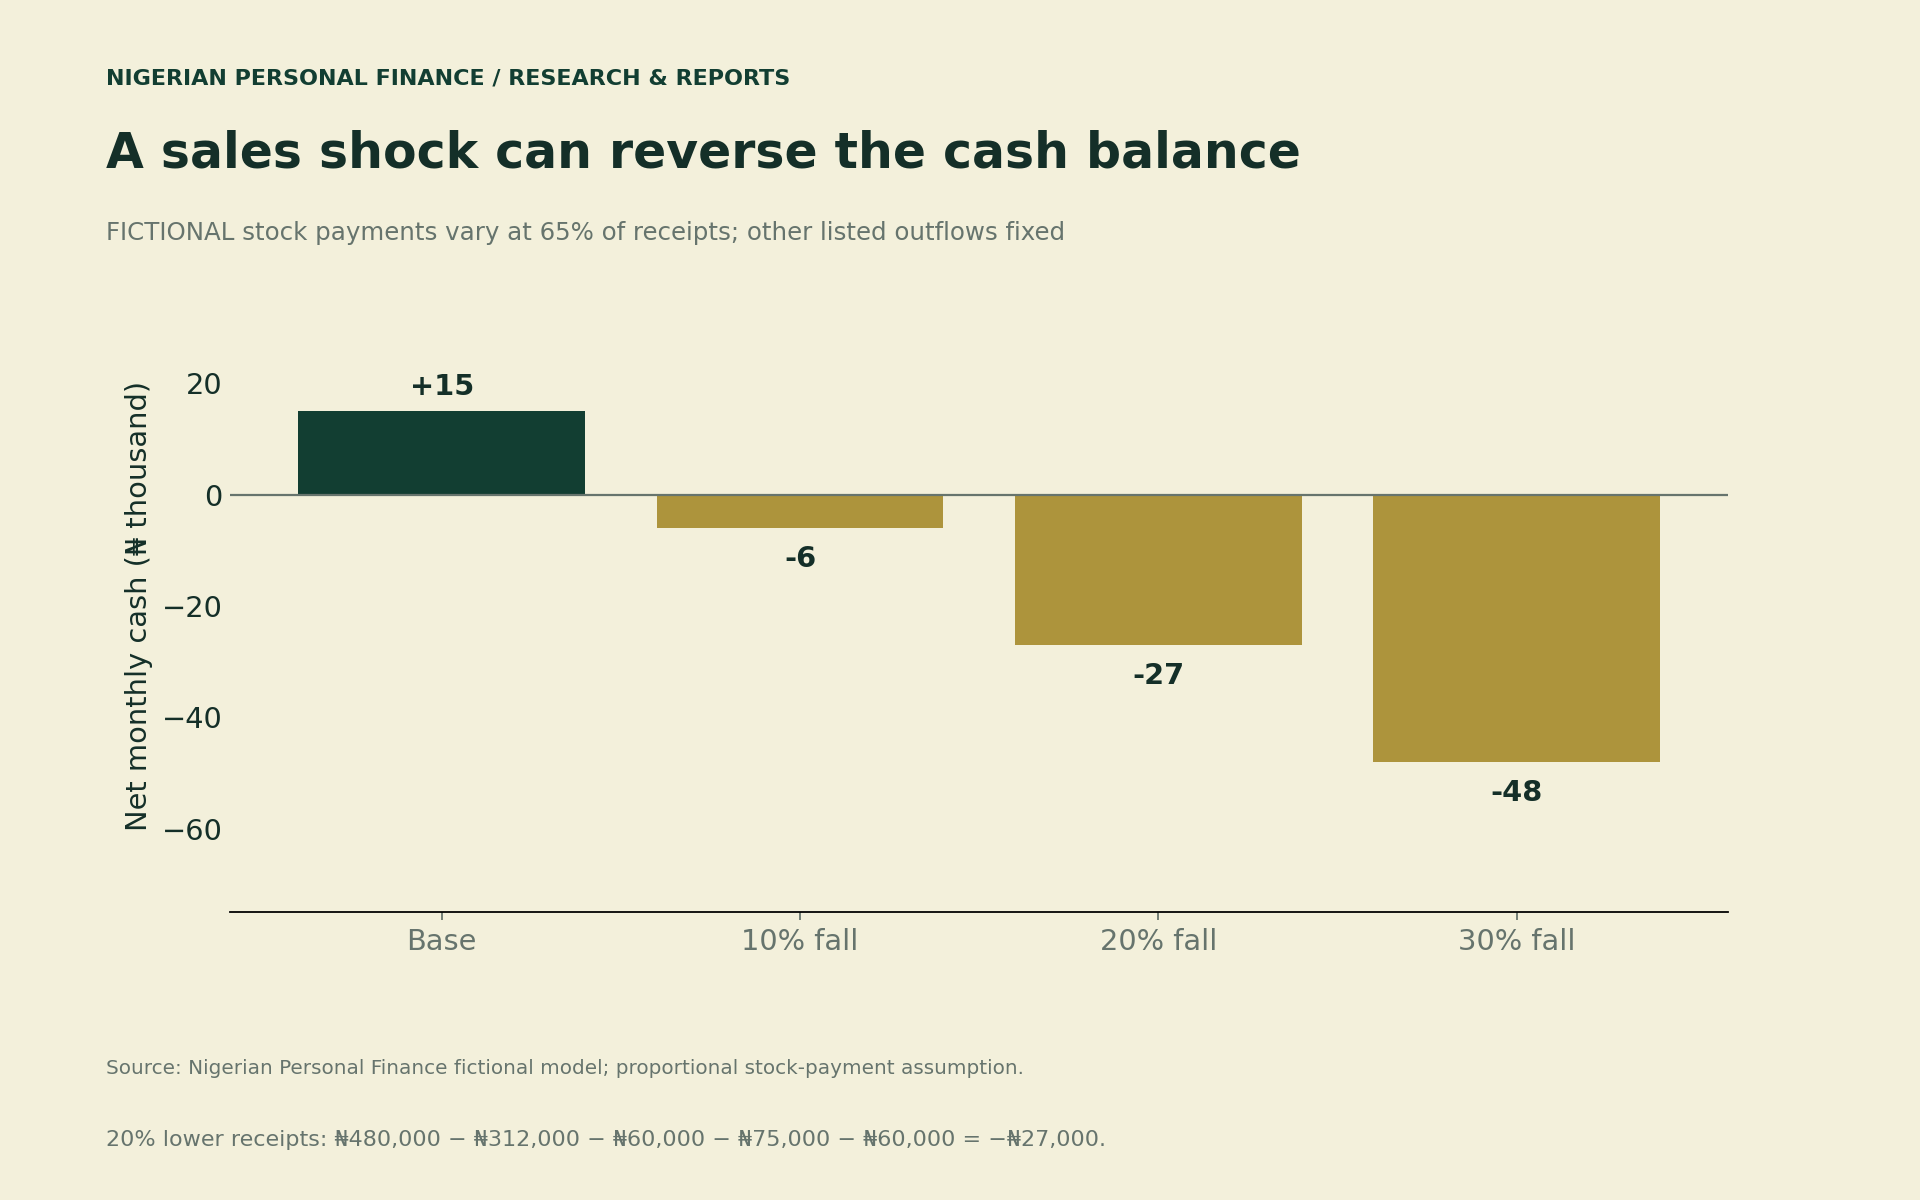
Next, reduce collected receipts by 20% to ₦480,000. Assume stock payments fall at the same time to 65% of receipts, or ₦312,000. Keep operating payments, debt service and household withdrawals unchanged. The new balance is ₦480,000 − ₦312,000 − ₦60,000 − ₦75,000 − ₦60,000 = −₦27,000.
This is a sensitivity test, not a prediction. A shop might already have paid for stock. A supplier might offer credit, or an essential repair might raise costs. If stock cash cannot adjust as quickly as assumed, the immediate gap could be larger. Put those timing details into the calendar rather than copying our ratio.
There is no universal safe repayment percentage in this exercise. A percentage cannot capture the timing of school fees, perishable stock or a customer who pays late. Start with your written loan schedule and actual records. If a quote is unclear, ask the provider to explain the cash you receive, every deduction and the full repayment schedule before you decide.
Why a positive month can still run short
Monthly totals can hide an earlier funding gap. To demonstrate, allocate the base month’s ₦15,000 net inflow across four invented weeks: −₦130,000, +₦60,000, +₦10,000 and +₦75,000. These weekly net amounts sum to ₦15,000. Their timing is an additional assumption, not survey evidence.
With ₦75,000 opening cash, the model falls to −₦55,000 after week one. It ends at ₦90,000 after week four. The negative point is a warning that the proposed schedule cannot run as drawn without some change or funding. It is not a recommendation to fill the gap with another loan.
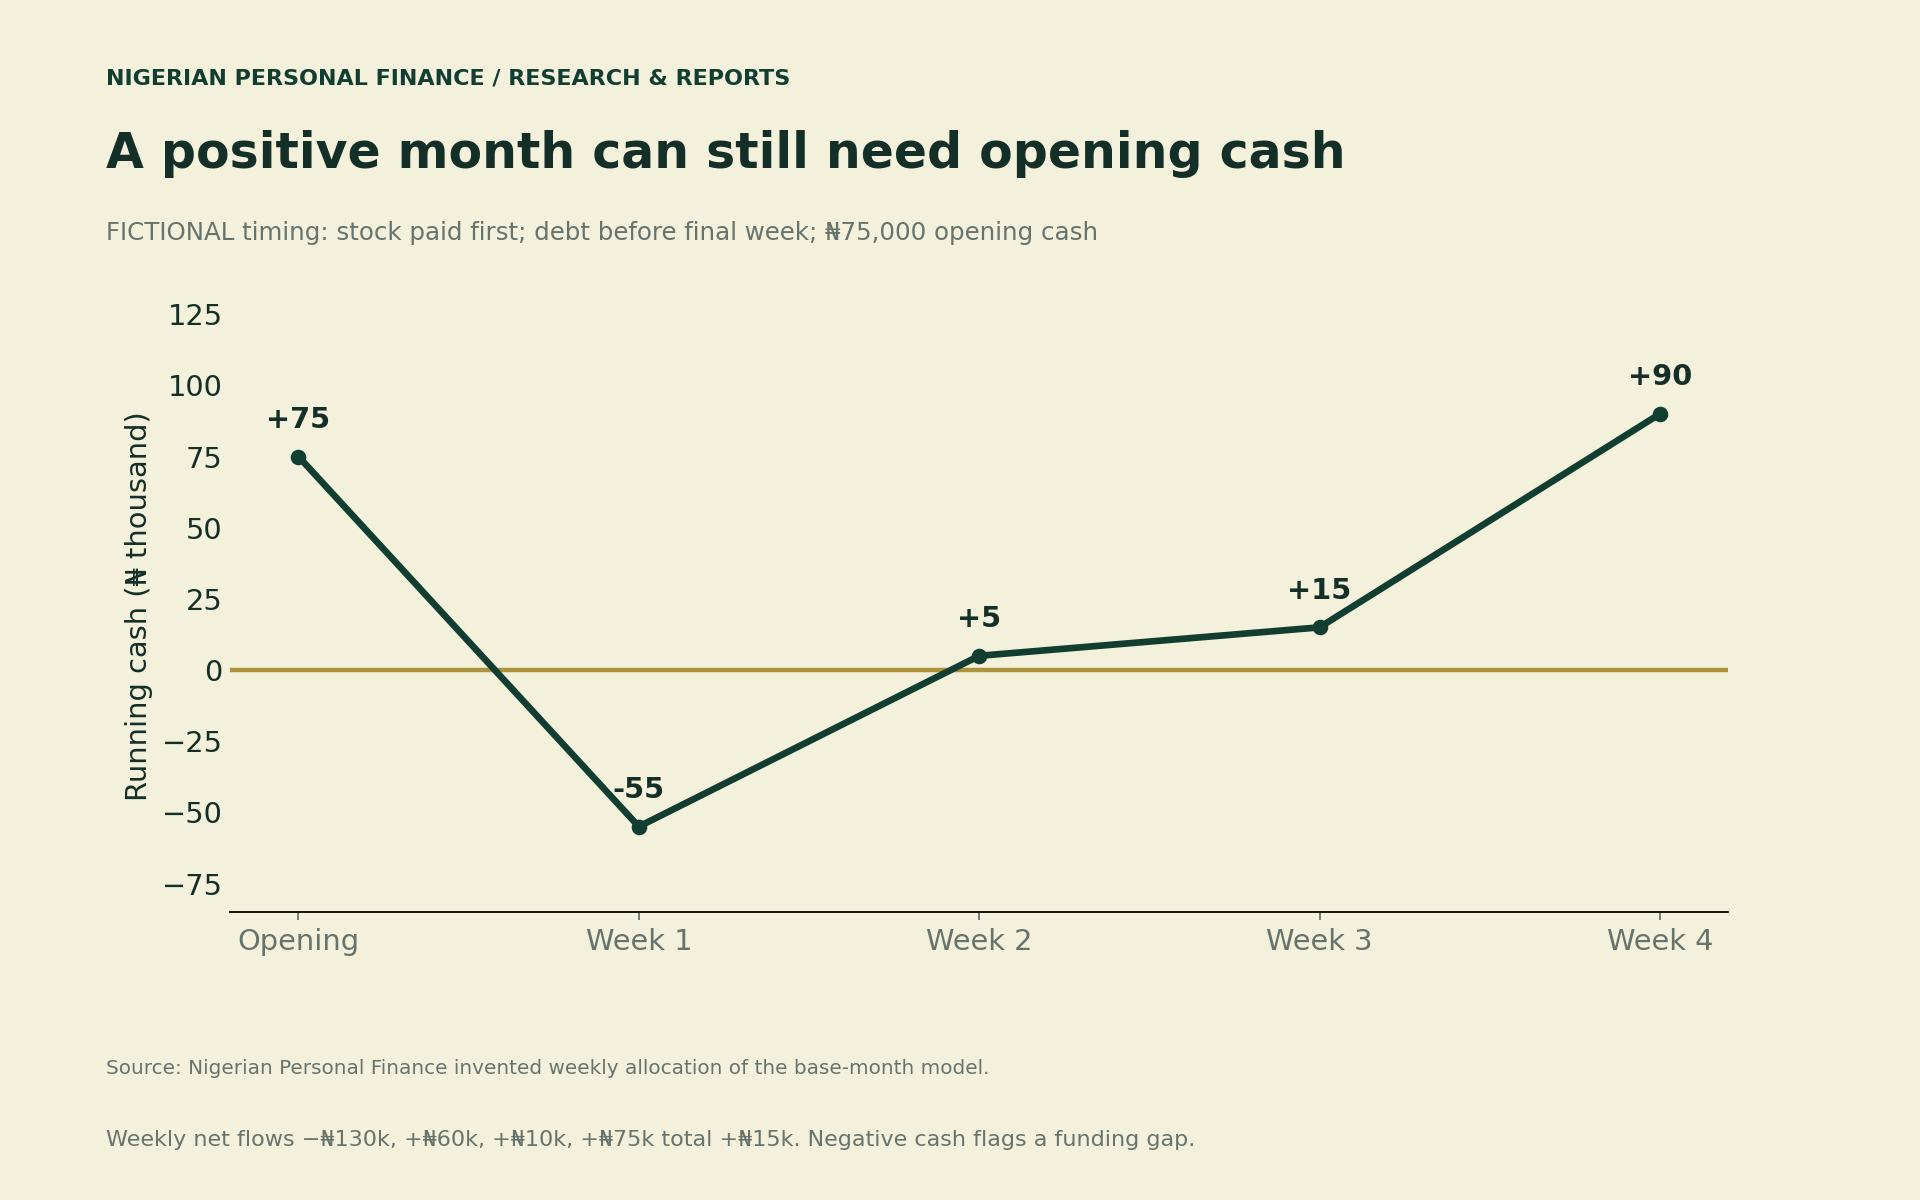
In a real plan, replace each net amount with dated receipts and individual payments. Mark customer receipts as confirmed or uncertain. Include tax, rent, equipment, existing debts and other commitments that our simplified model omits. Then check the lowest running balance, not only the last row.
Your Personalized Financial Plan
Get expert financial advice tailored exclusively to your goals. Receive a custom roadmap in just 1-3 business days.
Get StartedKeep household needs visible
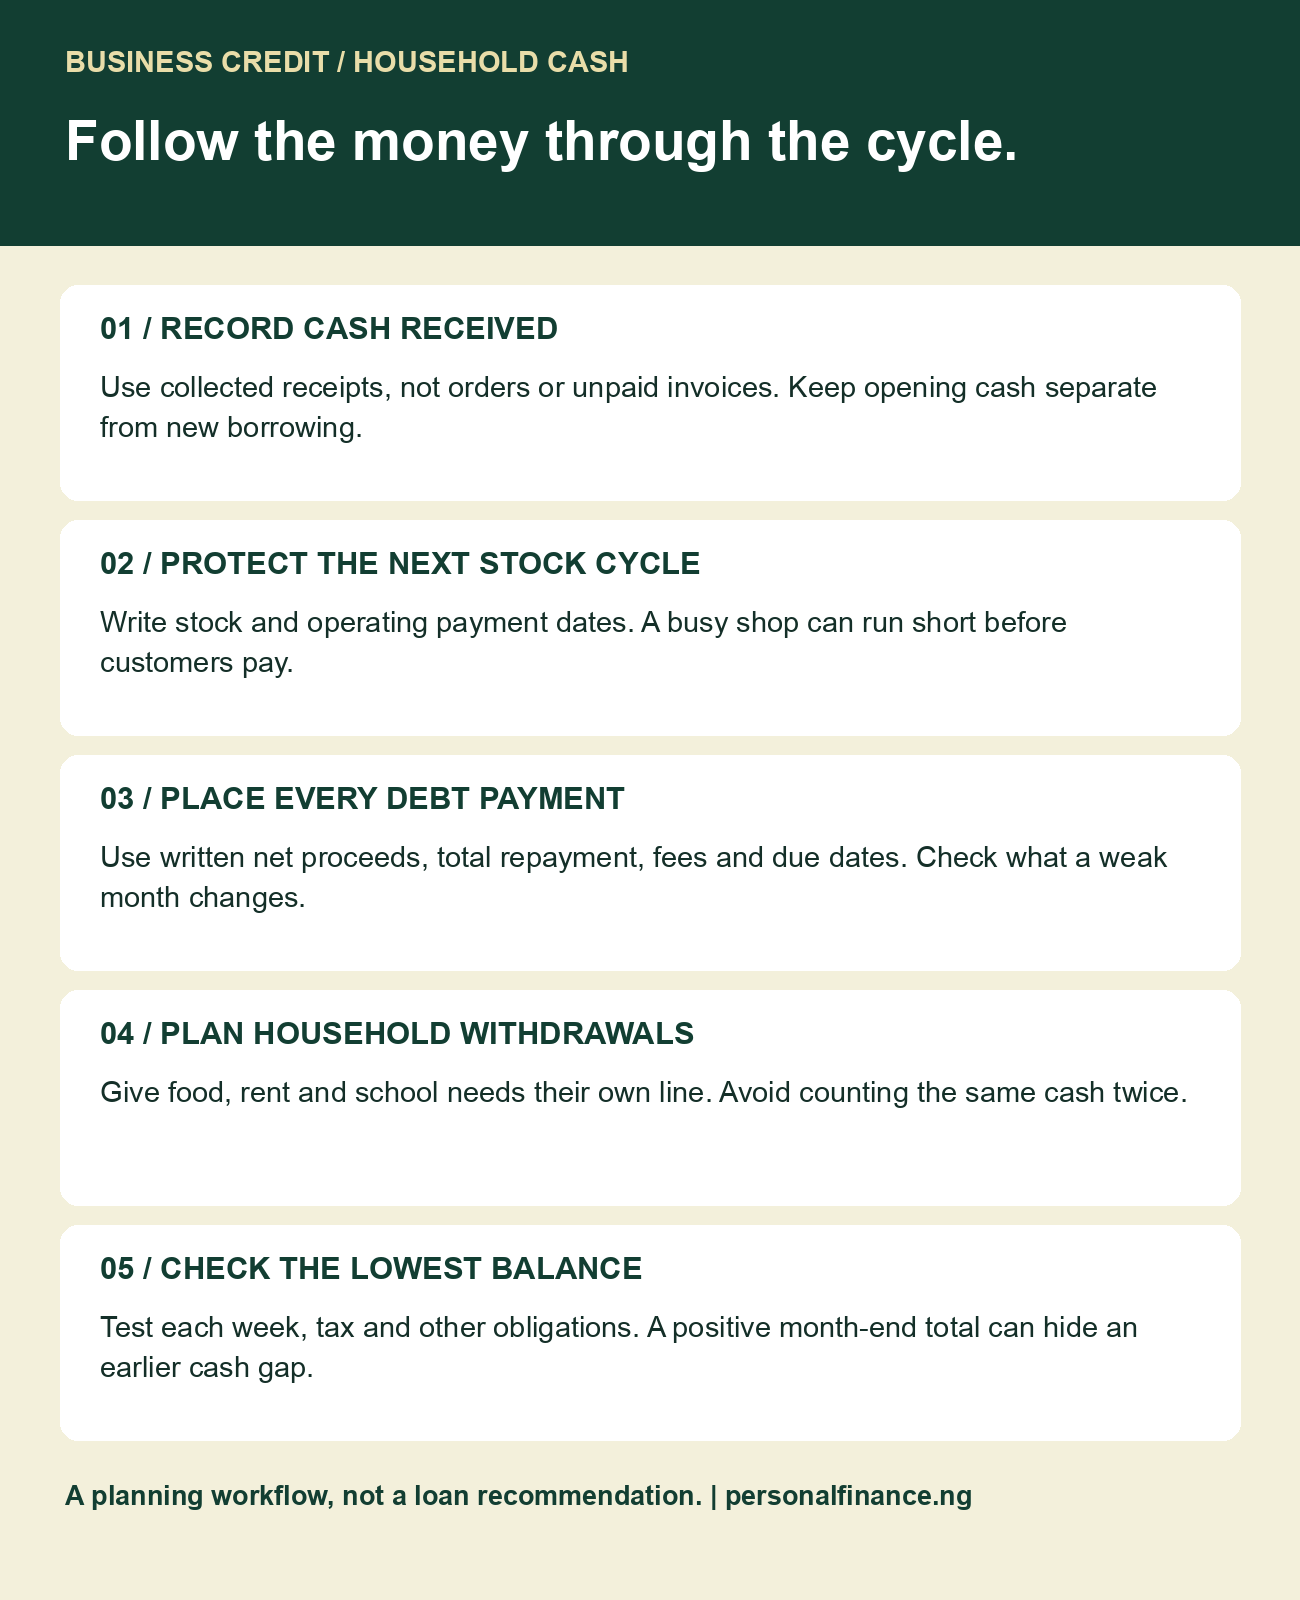
Business and household cash often meet in the same account. For planning, give household withdrawals their own line. This makes the trade-off visible without pretending family needs disappear when trading slows. The withdrawal is not automatically spare profit merely because money is in the till.
For example, compare the confirmed food and transport budget with the dates you must restock. Record any money returned to the business separately. Avoid counting one transfer as both a household resource and available stock cash. Our budgeting guides can help organise household categories alongside this business calendar.
Download the source extract and private planning tools
The files are plain CSVs. Blank cells are intentional, not zeros. Keep completed financial records private; do not post account numbers, identity documents or customer information. The worksheets do not assess credit eligibility or recommend a lender.
- Four-measure source extract with denominators (CSV) records the research measures and limits.
- Fictional monthly cash and receipts stress scenarios (CSV) retains all four model cases.
- Blank 13-week business and household cash calendar (CSV) lets you enter opening cash, dated flows and closing cash.
- Blank loan-quote and household-risk checklist (CSV) records written terms and unresolved questions.
For the blank calendar, calculate closing cash as opening cash plus collected receipts, minus every payment column. Carry that closing value into the next week’s opening balance. Separately identify any new borrowing or owner contribution in your notes so it does not masquerade as sales. Add columns for flows your business actually uses.
Methodology and limits
We checked the researcher’s account and EFInA listing on 6 November 2026. The EFInA-hosted original PDF supplies the four survey measures. We retained it and transcribed each denominator into the source CSV. We did not reconstruct respondent records, confidence intervals or subgroup counts from rounded percentages.
All cash amounts, ratios and weekly timing in Figures 3–5 are our invented teaching scenarios. They exclude inflation, tax, capital expenditure, supplier-credit detail, default charges and other unspecified costs. They therefore show how assumptions change cash, not how much any real household can afford to borrow. Consult a suitable financial or accounting professional about your circumstances and use the provider’s actual written terms.


