




Mutual fund NAV growth tells you how the value of reported assets changed. It does not tell you what your own investment earned. In Nigeria’s SEC workbook, aggregate net asset value rose by 0.8325% between 9 and 16 October 2026. Calling that your personal weekly return would skip several essential checks.
The reported total moved from ₦9.884732 trillion to ₦9.967020 trillion. Our subtraction gives an increase of ₦82.287 billion. New money, withdrawals and changes in asset values can all affect the size of an industry. The two totals alone cannot isolate those components.
This guide, checked on 30 October 2026, provides five figures and three downloadable tables. Use them to trace the industry calculation and organise an investment-statement audit. They provide financial education, not a fund ranking or a recommendation about where your money belongs.
What SEC published, and what dates it measured
The SEC’s live 2026 weekly NAV listing dates this release 23 October 2026. The original regulatory workbook reports values as at 16 October. For this comparison, we use its 9 October and 16 October columns. The publication date and observation dates answer different questions.
The commissioning research also recorded a 25 October search-index date. We retain the live page’s 23 October listing date and disclose that metadata inconsistency. Neither date changes the observation period inside the file. A release in late October does not mean the assets were measured on publication day.
Reproduce the mutual fund NAV growth calculation
Open the workbook’s NAV Trend sheet. Cell I11 contains ₦9,884,732,462,100.695 for 9 October; J11 contains ₦9,967,019,815,559.178 for 16 October. First subtract I11 from J11. Then calculate (J11 / I11 − 1) × 100 for percentage growth.
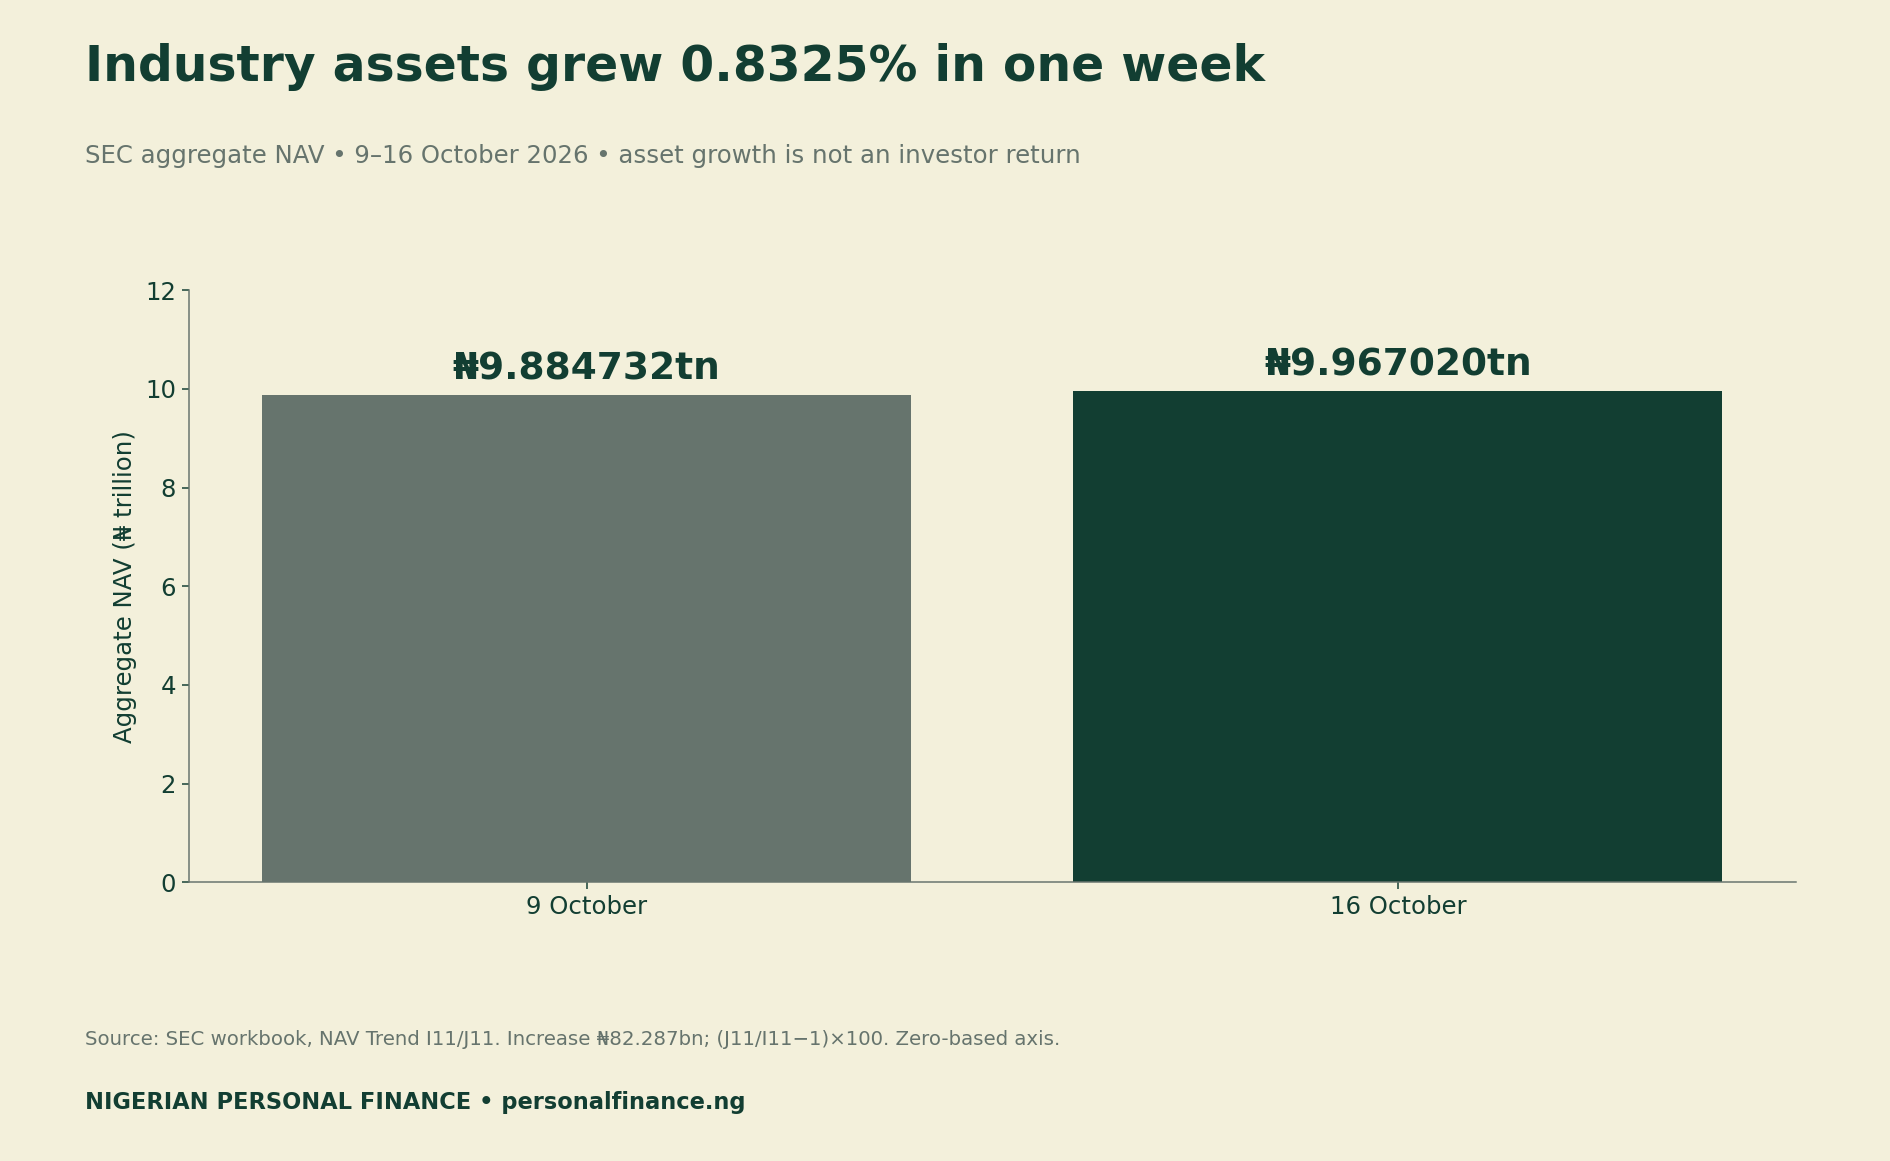
| Measure | Calculated result | Interpretation |
|---|---|---|
| Starting aggregate NAV | ₦9.884732tn | 9 October 2026 industry assets |
| Ending aggregate NAV | ₦9.967020tn | 16 October 2026 industry assets |
| Difference | ₦82.287bn | Change in aggregate assets |
| Percentage change | 0.8325% | Growth in the reported asset total |
We preserve the workbook’s precision for calculations and round only the displayed results. The nine category values reconcile to each total within ₦0.01, a tolerance for floating-point arithmetic. The ending residual is less than one kobo. We also cross-check the categories against NAV Comparison, where the workbook expresses them in billions.
Composition describes size, not the best investment
Money-market funds account for ₦6.787302 trillion of the 16 October total. Dividing that value by ₦9.967020 trillion gives approximately 68.10%. It is a share of reported assets. It is not a share of investors, a promised yield or evidence that this category suits every household.
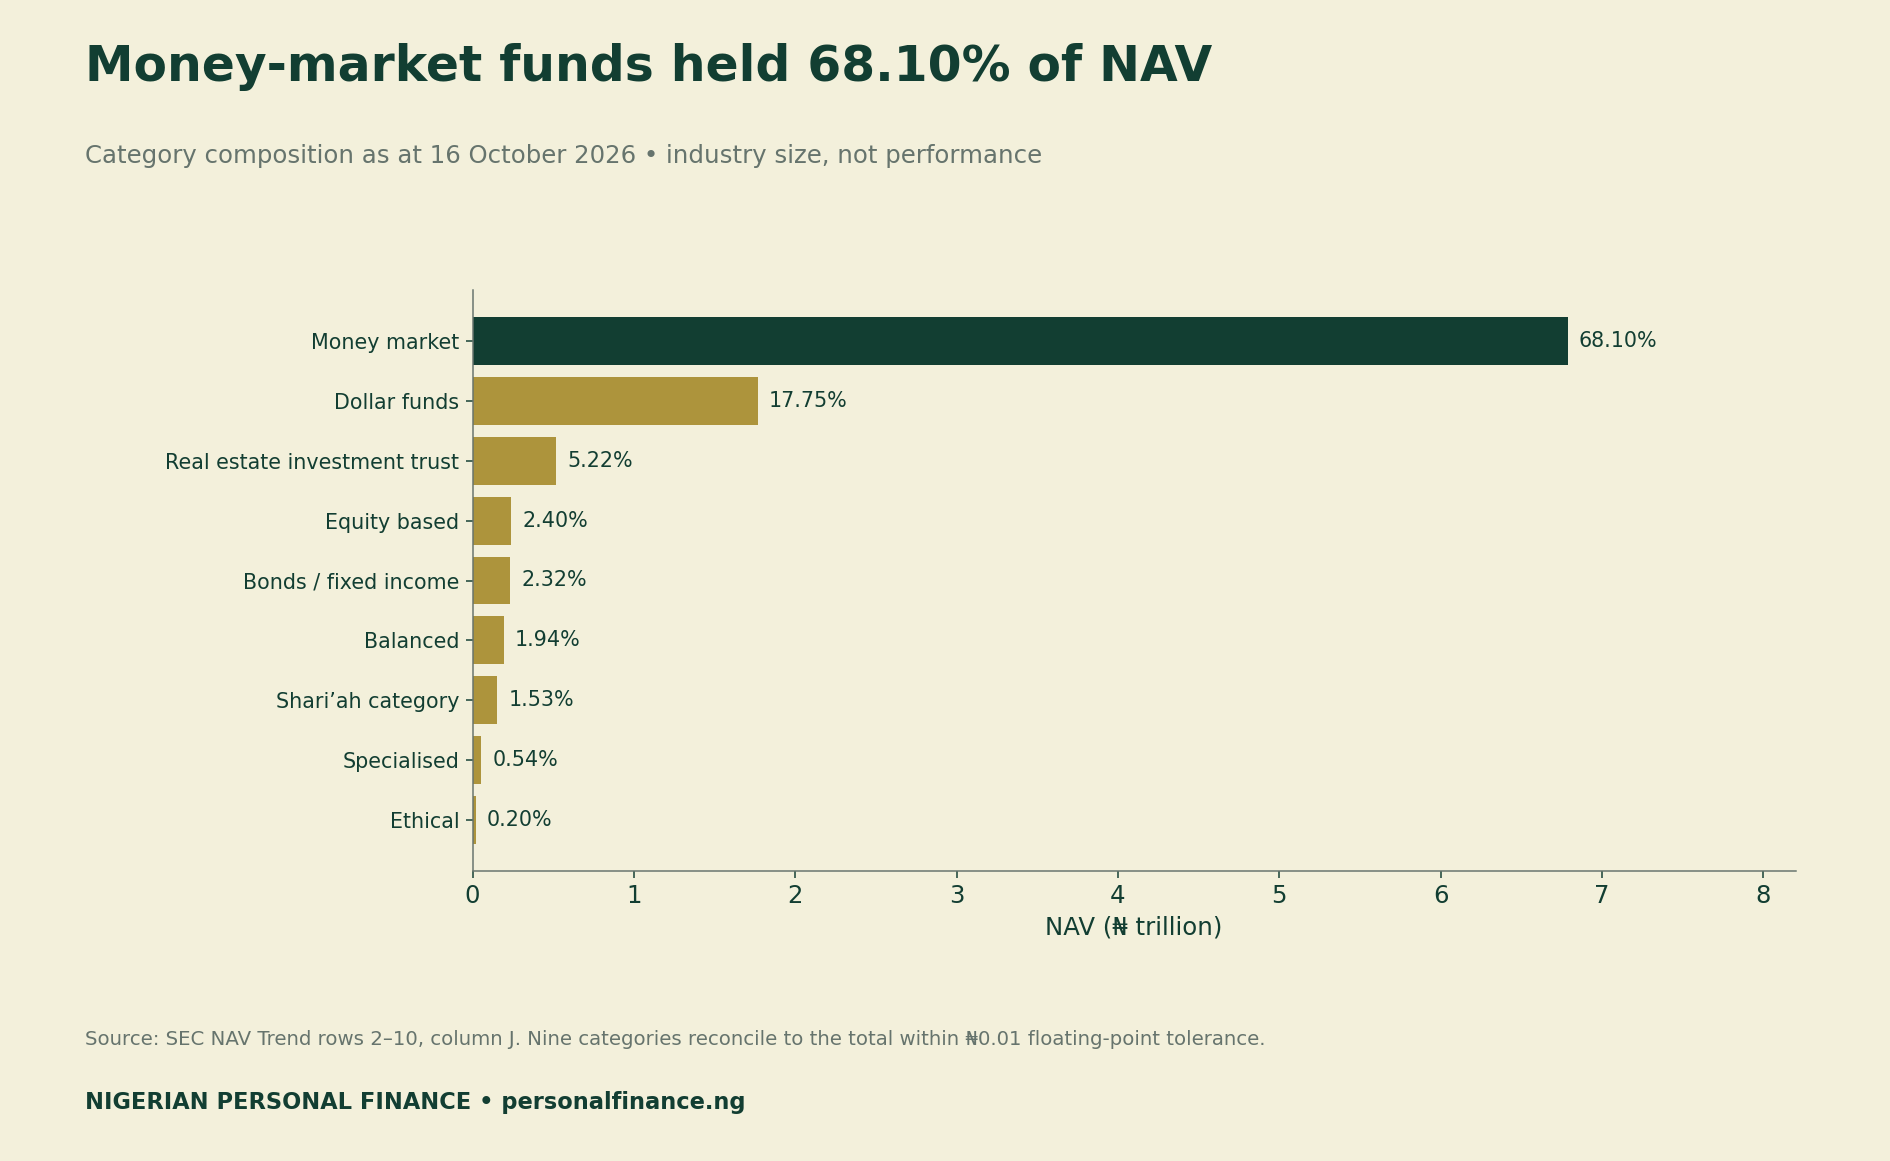
Likewise, a large fund can hold more assets because it attracted more subscriptions. A smaller category can shrink even if some of its investors earned gains. Without the necessary flow and valuation breakdown, the aggregate figures cannot tell us which mechanism caused the change.
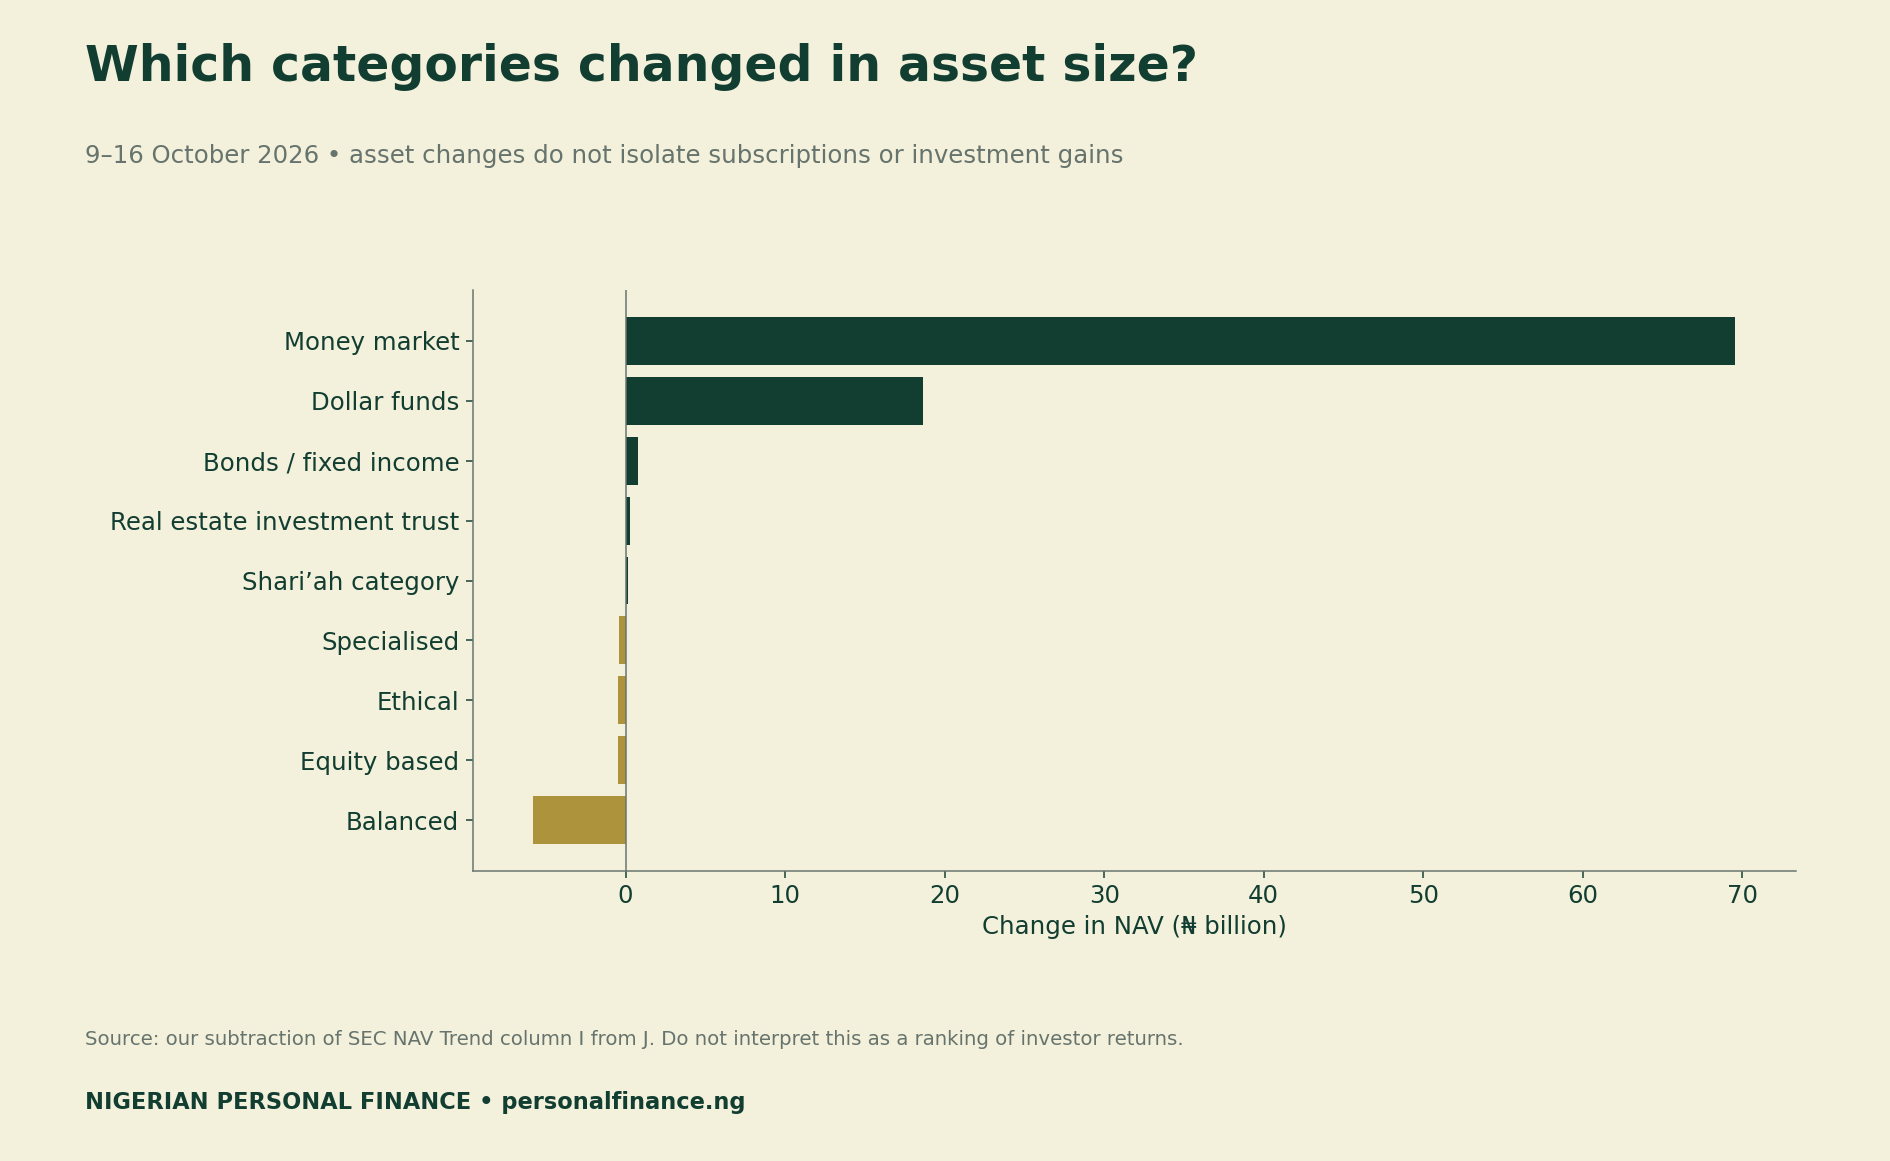
For example, money-market assets increased by about ₦69.561 billion, while balanced-fund assets fell by about ₦5.820 billion. Those are differences between reported asset values. We do not infer net subscriptions, investor losses or the cause of either movement from the subtraction alone.
Move from industry NAV to your own experience
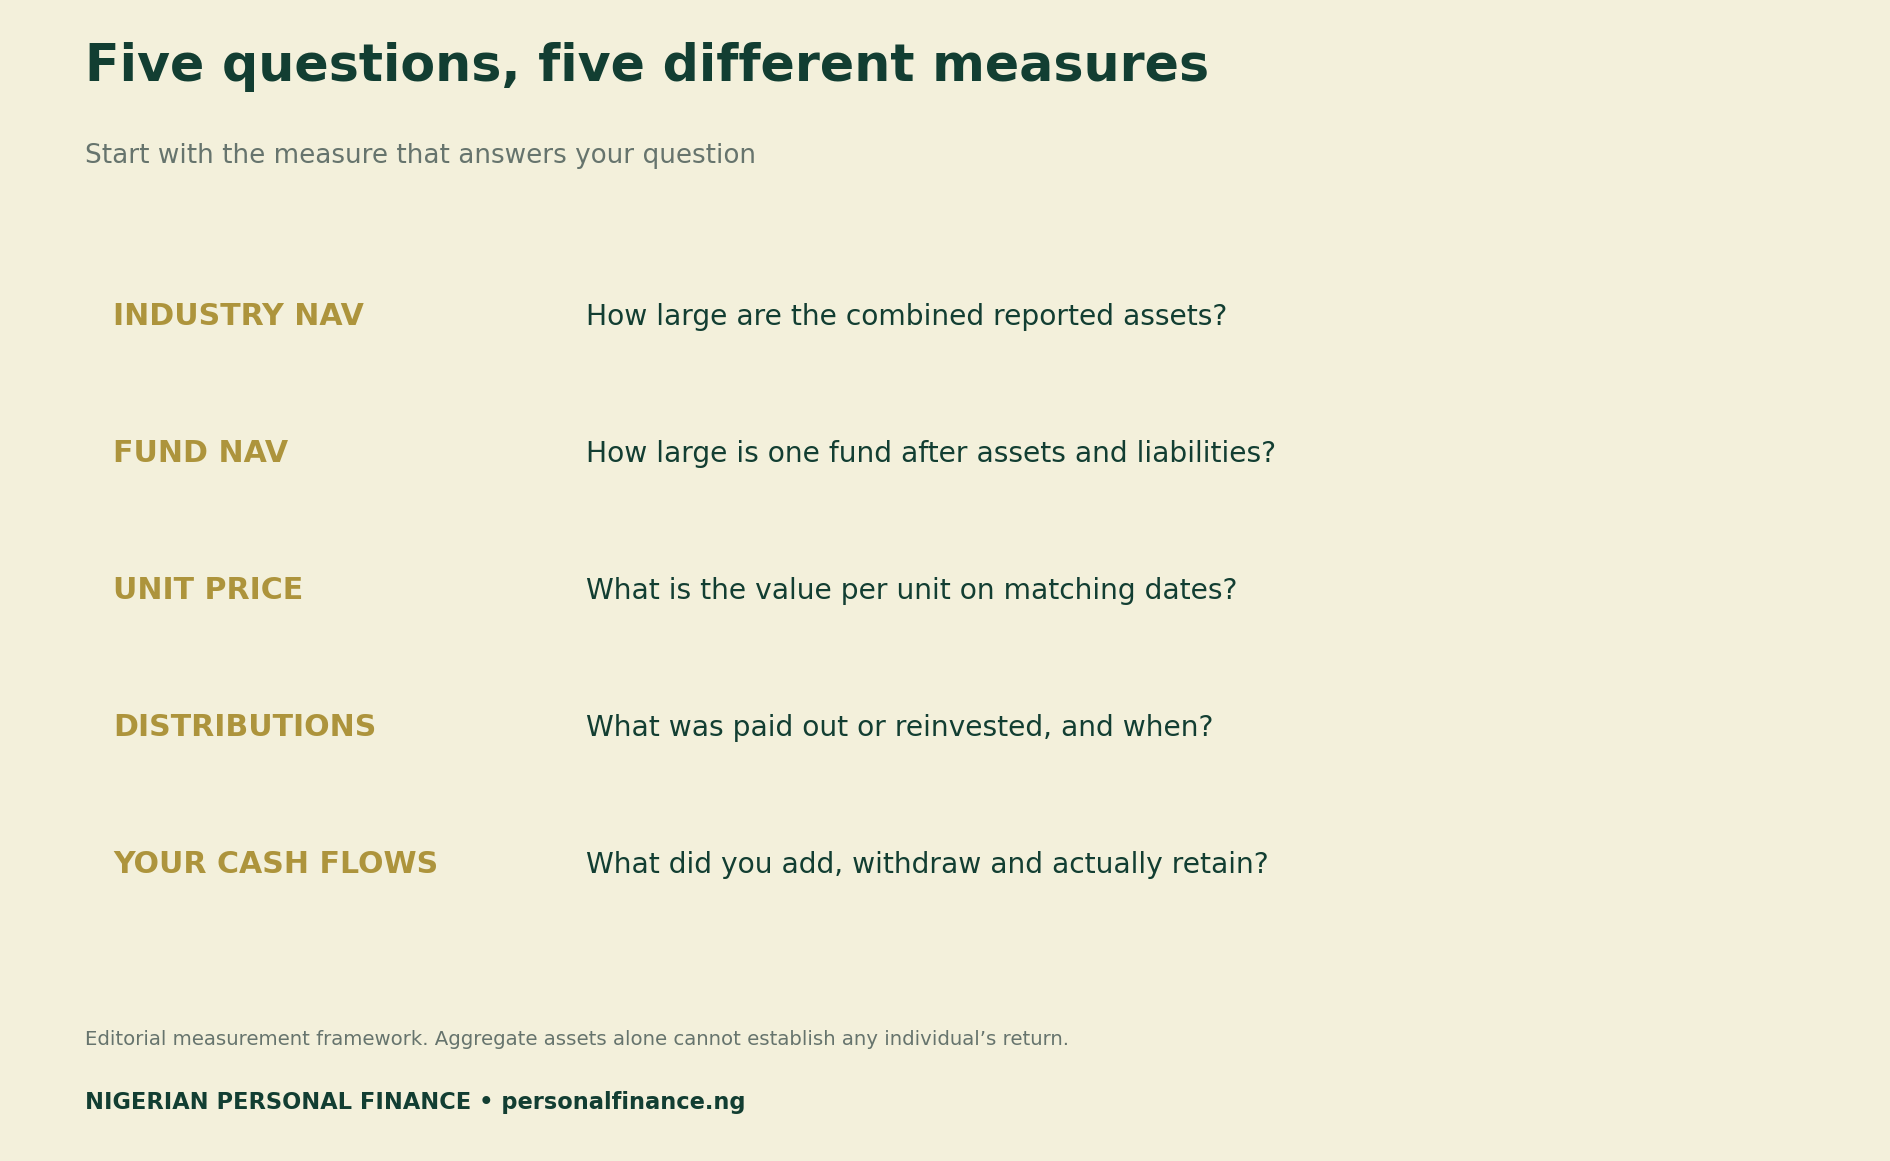
First identify whether the number concerns the entire industry, a category or your specific fund. Next, separate that fund’s total NAV from its value per unit. Total fund assets and a unit price are different measures, especially when investors buy or redeem units.
Then check distributions. A cash payment can leave the fund while still contributing to your overall gain. A reinvested distribution can affect units or closing value. Therefore, trace how the statement records it before adding it again. Otherwise, one payment could count twice.
Finally, list your own contributions and withdrawals with their dates. Someone who invested midway through a period did not hold the same balance throughout. Consequently, even a correctly reconciled cash gain does not automatically establish a timing-adjusted percentage return.
Audit the statement in cash amounts first
Choose matching opening and closing dates. Record the value on each date, then total contributions, withdrawals and any cash distributions that are outside the closing value and not already included in withdrawals. Use one currency consistently, or document conversion separately rather than silently mixing units.
Reconciled gain or loss = closing value − opening value − contributions + withdrawals + cash distributions not already counted. This identity removes money you added and restores money you took out. It produces an amount. By itself, it does not calculate an annualised or money-weighted return.
Your Personalized Financial Plan
Get expert financial advice tailored exclusively to your goals. Receive a custom roadmap in just 1-3 business days.
Get Started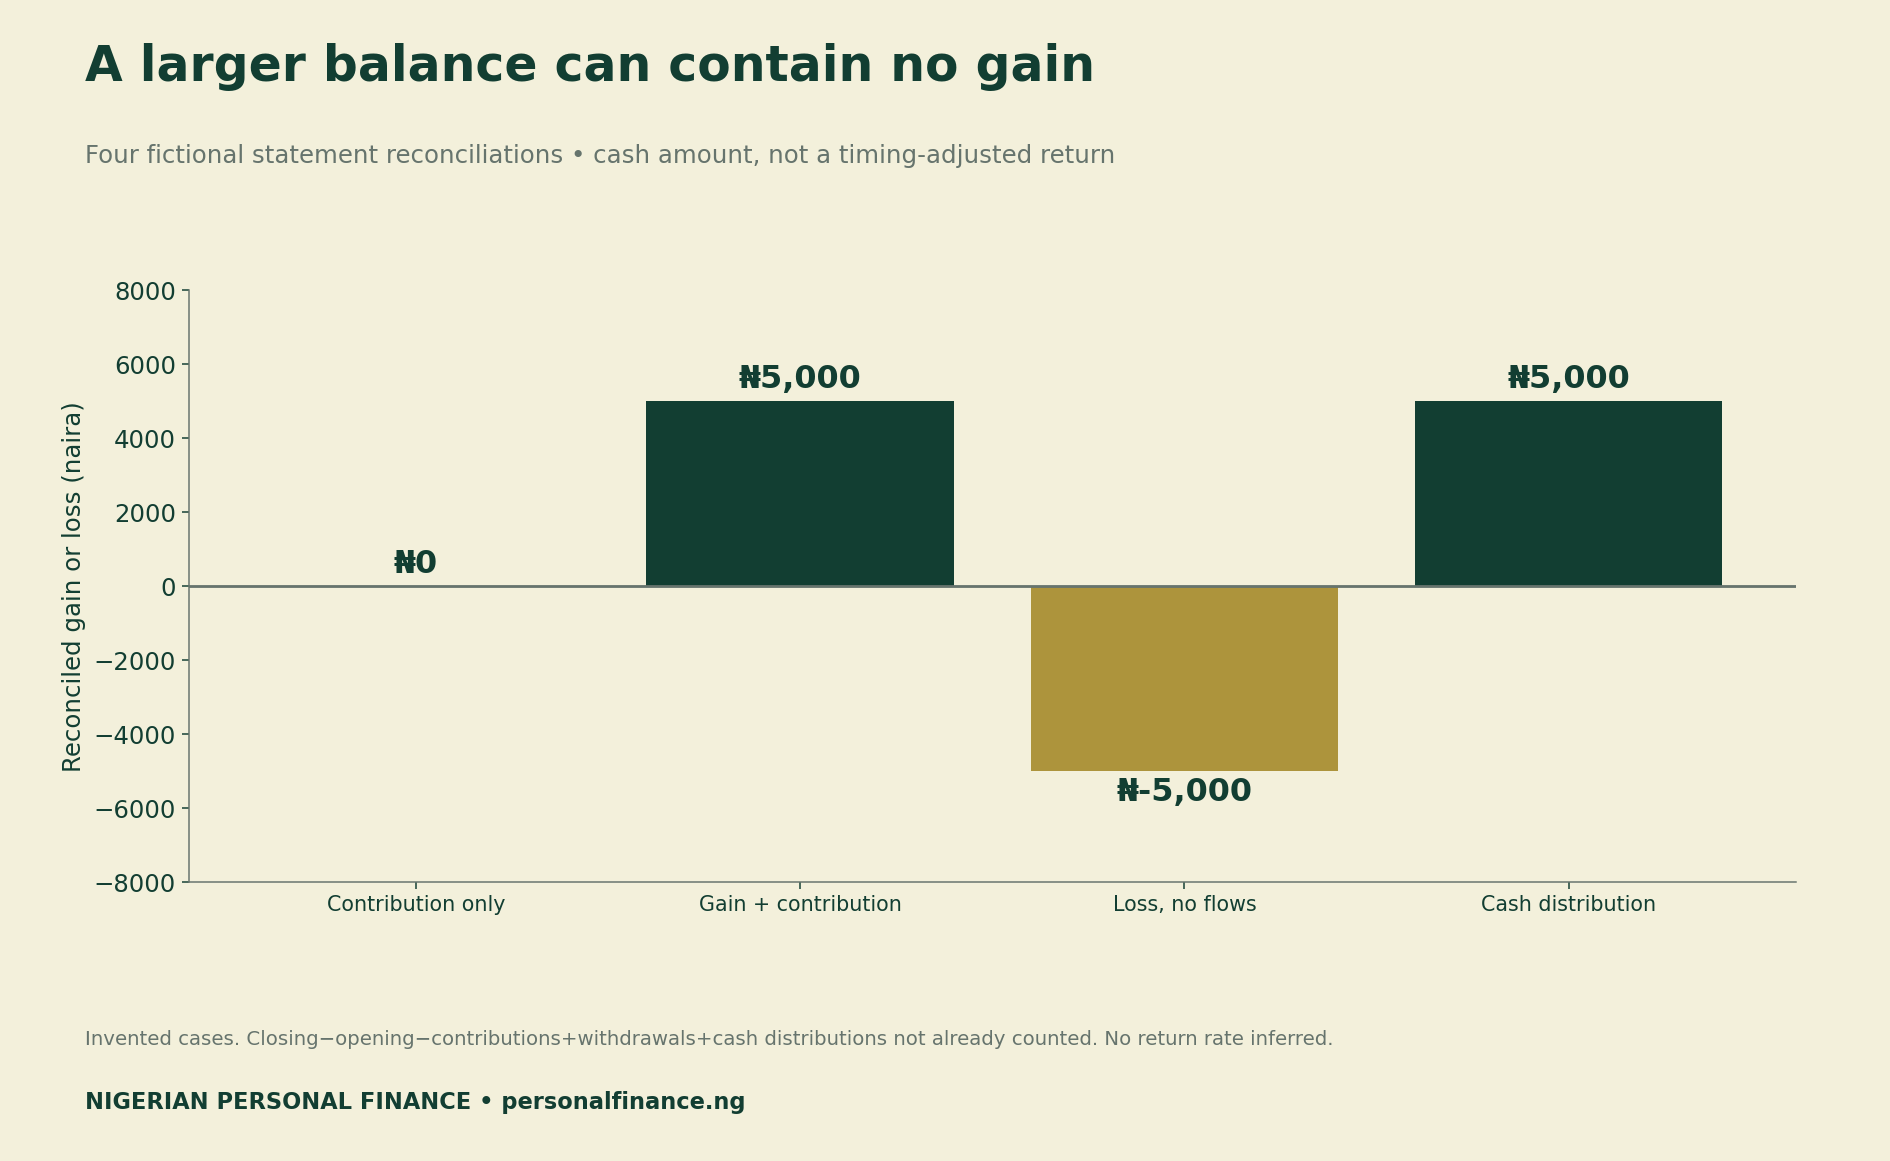
| Fictional case | Opening | Added | Closing | Extra cash distribution | Reconciled gain |
|---|---|---|---|---|---|
| Contribution only | ₦100,000 | ₦20,000 | ₦120,000 | ₦0 | ₦0 |
| Gain plus contribution | ₦100,000 | ₦20,000 | ₦125,000 | ₦0 | ₦5,000 |
| Loss, no flows | ₦100,000 | ₦0 | ₦95,000 | ₦0 | −₦5,000 |
| Separate cash distribution | ₦100,000 | ₦0 | ₦102,000 | ₦3,000 | ₦5,000 |
In the first case, the balance rises by 20% because the investor adds ₦20,000. The cash reconciliation shows no gain. In the final case, the ₦3,000 distribution is outside the closing value. If the statement already included that payment elsewhere in the calculation, adding it again would overstate the gain.

Download the statement audit and data
SEC category calculation data (CSV) contains both dates, closing shares, changes and original cell references for all nine categories. It supports reproduction of the first three figures. The file preserves numerical precision beyond the rounded labels in this article.
Blank investor-statement audit (CSV) records opening and closing values, dated-flow totals, distributions, fee treatment and unresolved items. Keep a separate dated transaction log when you complete it. The CSV is a plain worksheet, not a calculator that automatically adjusts for timing.
Fictional statement examples (CSV) gives the four inputs and outputs behind Figure 5. It makes the subtraction auditable without publishing anyone’s financial records. The website does not collect completed statements, account numbers or credentials.
Questions to resolve with the fund manager
Ask which valuation dates and unit prices match your statement period. Next, confirm how the manager records distributions, purchases, redemptions and fees. A fee already reflected in the closing valuation should not be subtracted a second time. A separately paid fee needs its own consistent treatment when you assess your overall cash outcome.
Also ask what any yield field actually measures. A percentage labelled yield may follow a different period or annualisation convention from the weekly asset comparison. We do not read an unverified yield column as a one-week realised return. Request the definition rather than borrowing a convenient percentage.
For another denominator check, use our Treasury bill discount calculator. It separates face value from cash paid and labels annualisation explicitly. Our retirement paperwork and healthcare budget checklist similarly distinguishes confirmed facts from unresolved household cash assumptions.
Method, limitations and corrections
We downloaded the SEC’s original workbook, extracted NAV Trend rows 2–11 and retained the source for verification. We compared columns I and J, excluded the total from category sums, and cross-checked the comparison sheet’s billion-naira units. Scripts generate the figures and data, with full precision retained until display rounding.
The category reconciliation passes a one-kobo tolerance at both dates. The four fictional statement cases pass independent amount checks: zero, plus ₦5,000, minus ₦5,000 and plus ₦5,000. No timing-adjusted return calculator is included. Such a tool would require documented cash-flow signs, dates and further tests.
The workbook does not supply a complete personal transaction history for each investor. It therefore cannot establish an individual return or identify net subscriptions from aggregate asset growth alone. We make no fund ranking, suitability assessment or claim that a category’s size predicts future gains. Corrections log: initial source and calculation checks completed on 30 October 2026.
Suggested citation: Nigerian Personal Finance, “Nigerian Mutual-Fund NAV Growth Is Not Your Return: Statement Audit,” 30 October 2026. Cite SEC for the original asset values and identify the percentages, charts and fictional examples as our calculations.