




This Treasury bill calculator separates the face value of a bill from the cash you pay today. That matters because a discount rate and a return on cash use different denominators. Before comparing a percentage in a headline with a dealer’s quote, check which amount sits underneath it.
Using the historical 28 October 2026 stop rates reported by AIICO Capital, our ₦1 million face-value examples produce cash prices of ₦961,605.48, ₦921,266.30 and ₦842,432.88. These are actual-days/365 illustrations before fees, tax or other adjustments. They are not executed trades or current retail offers.
We checked this article on 30 October 2026. It provides calculation education and a quotation worksheet, rather than a recommendation to buy a bill or lock away emergency cash. Confirm settlement conventions and all charges with the dealer before relying on a quote.
The dated auction snapshot
AIICO Capital’s report dated 28 October gives stop rates of 15.40%, 15.79% and 15.80% for 91, 182 and 364 days. Its original PDF, page 3, reports ₦1.91 trillion bid, ₦800 billion offered and roughly ₦71.16 billion sold. We attribute these figures to the investment manager’s contemporary reporting, not an independently obtained official auction return.
Keep the auction narrative separate from the secondary-market yield table on that page. The table uses different tenor labels and rates. We did not substitute those figures into a discount-rate formula or imply that every retail customer could access the historical auction terms.
Four numbers to identify in a quote
| Measure | What it means | Question to ask |
|---|---|---|
| Face value | Amount used as the maturity starting point | How much is due before deductions? |
| Cash price | Face value less the calculated discount | Which day-count and settlement rule apply? |
| Total outlay | Cash price plus upfront charges | What leaves the account in total? |
| Net maturity receipt | Face value less applicable deductions | What should arrive, in which account and when? |
A quoted percentage cannot answer all four questions. Request the monetary amounts and dates as well. Also, check whether a charge is already inside the quoted settlement amount. Adding the same fee again would understate your return; ignoring a separate fee would overstate it.
How the Treasury bill calculator works
For this illustration, face value is ₦1,000,000 and the day-count base is 365. Let d be the discount rate as a decimal, t the number of days and F the face value. A 15.80% rate therefore enters the formula as 0.158, not 15.80.
Discount = F × d × t / 365. Then calculate cash price = F − discount. Before fees and deductions, the holding-period return is discount / cash price. Keep full precision in these steps and round only the displayed answer.
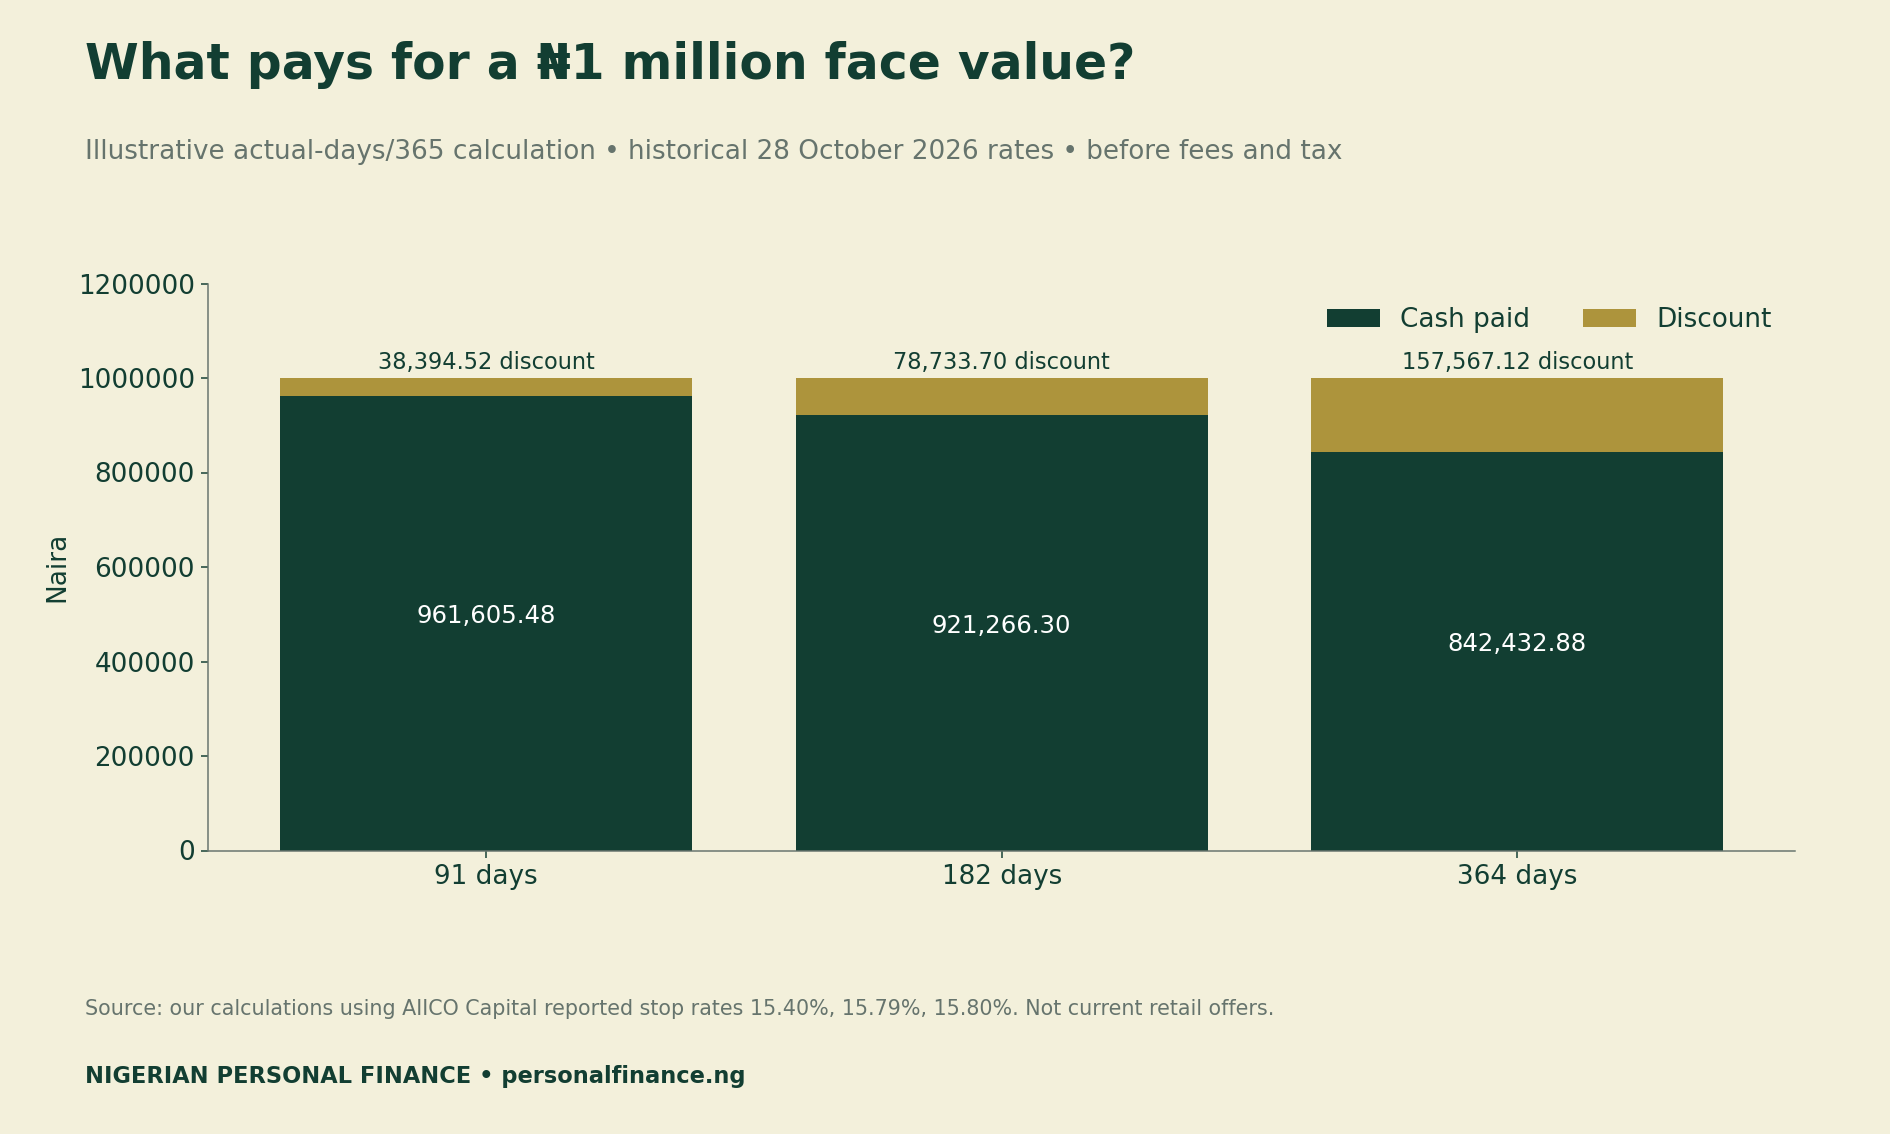
| Days | Discount input | Cash price (₦) | Discount (₦) | Period return |
|---|---|---|---|---|
| 91 | 15.40% | 961,605.48 | 38,394.52 | 3.99% |
| 182 | 15.79% | 921,266.30 | 78,733.70 | 8.55% |
| 364 | 15.80% | 842,432.88 | 157,567.12 | 18.70% |
For the 364-day example, the discount is ₦157,567.12 and the cash price is ₦842,432.88. Dividing the discount by that smaller cash amount gives about 18.70% for the 364-day holding period. Dividing by face value instead answers a different question.
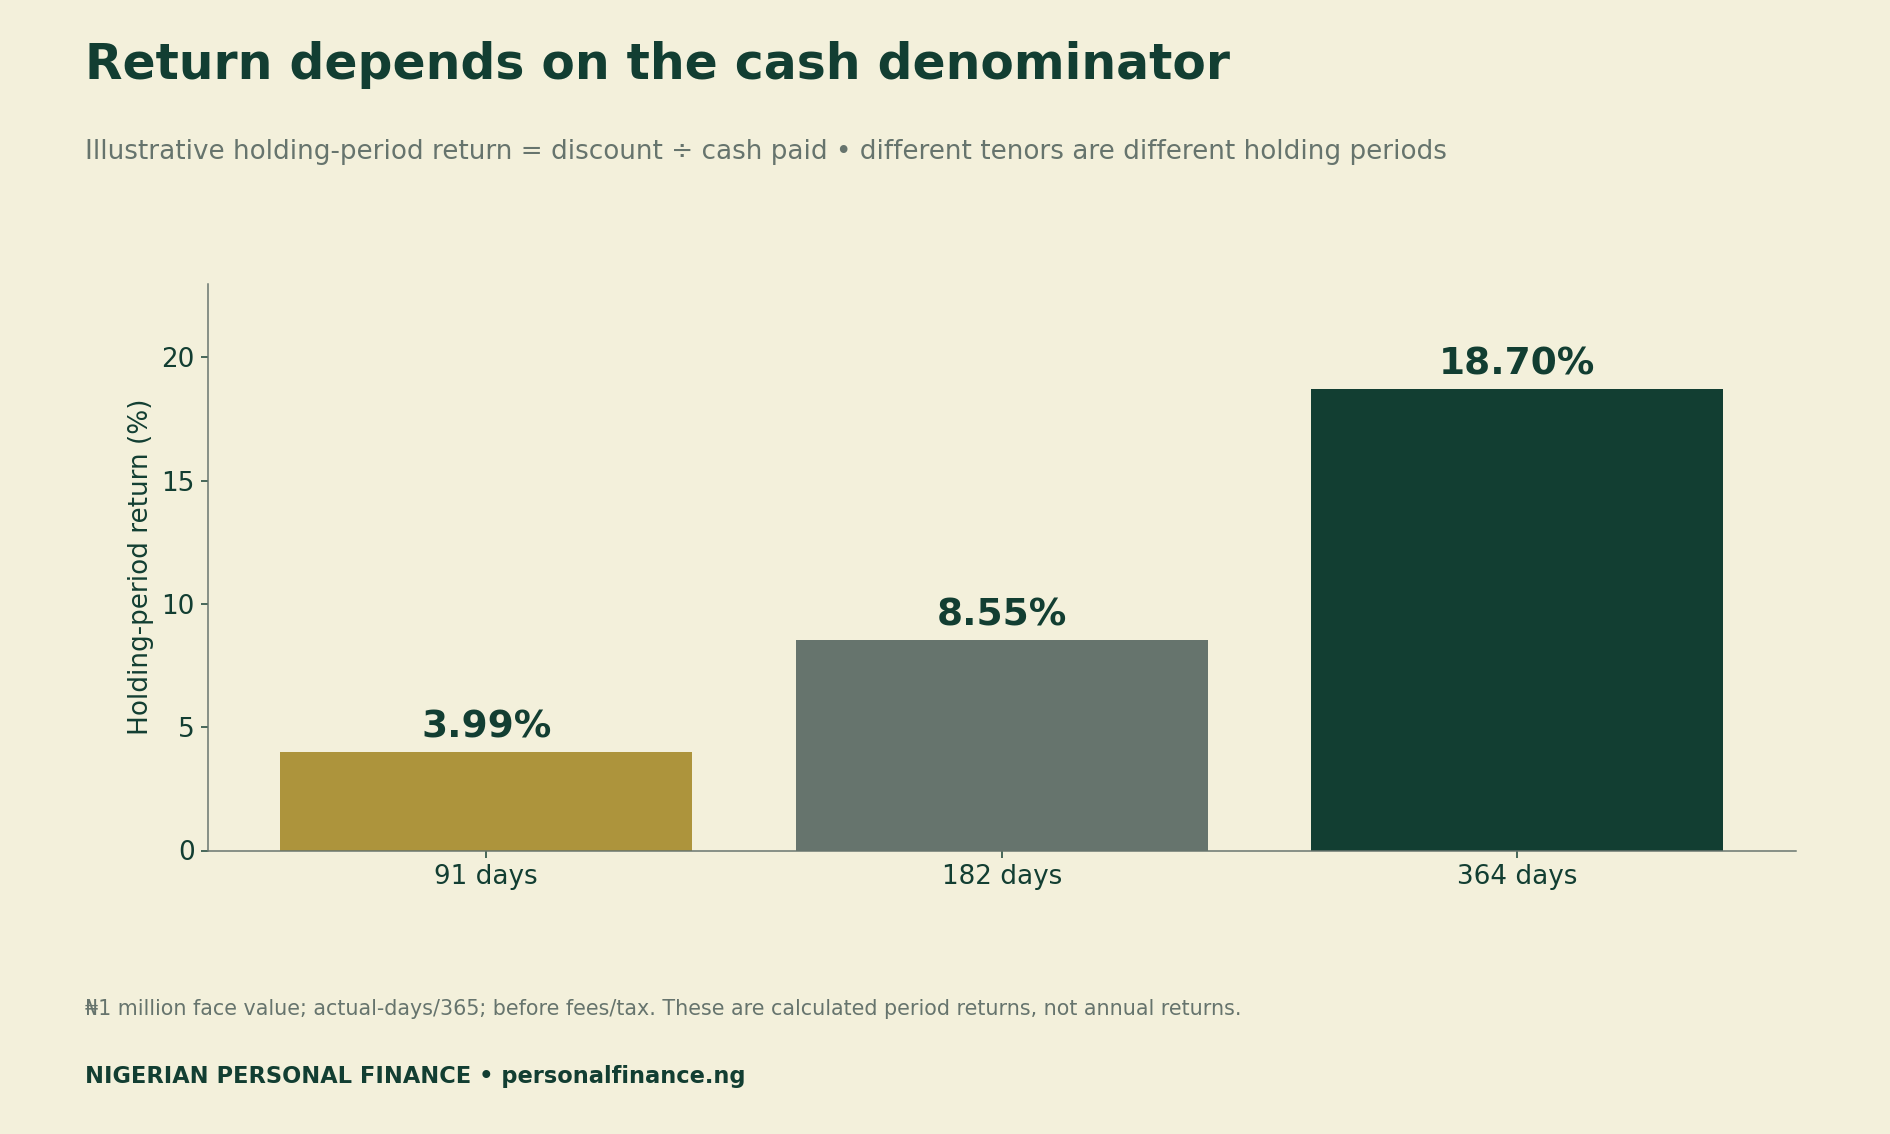
Simple annualisation is another distinct percentage
An optional simple annualised rate multiplies the period return by 365 divided by days. For these examples, it gives 16.01%, 17.14% and 18.76%. This is a scaling convention, not proof that you earned that much over a full year.
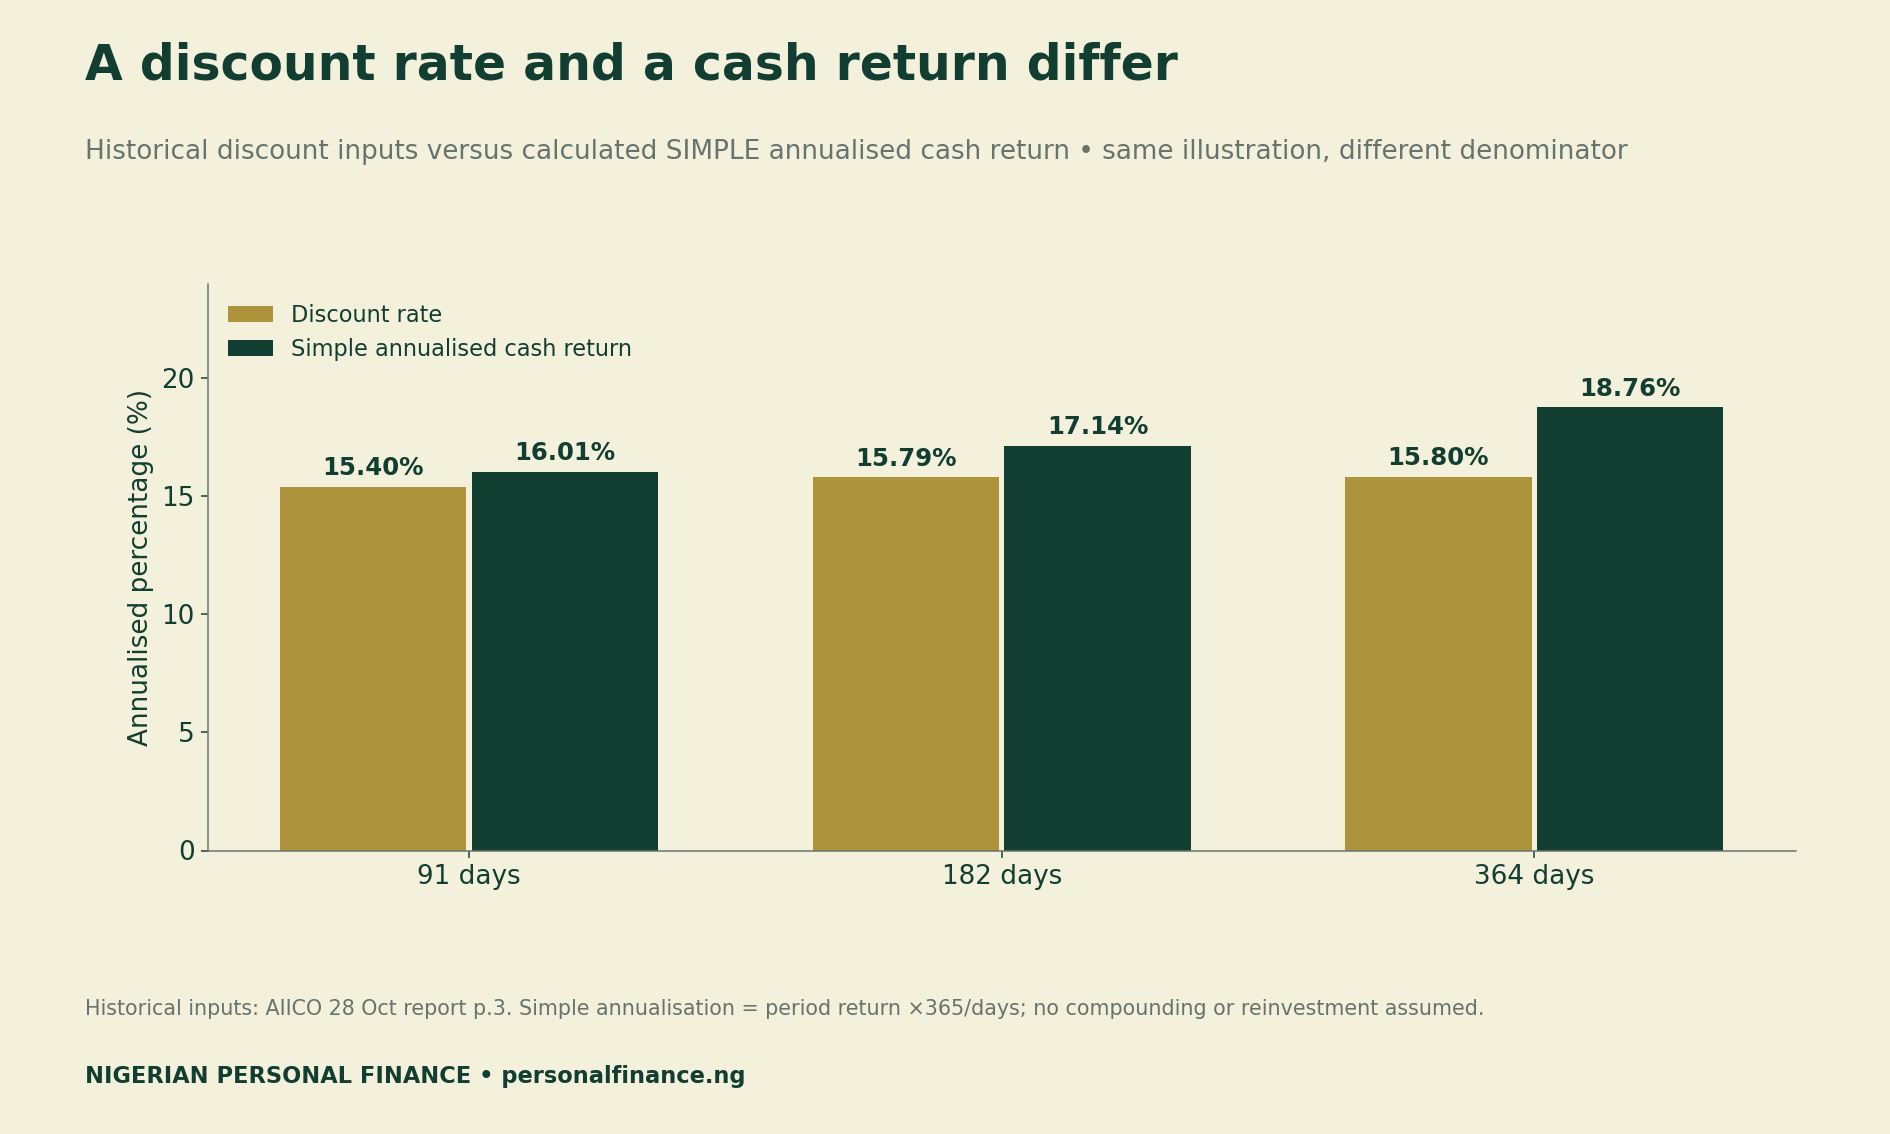
For example, the 91-day illustration produces a 3.99% holding-period return. It does not produce a 16.01% cash gain in 91 days. Repeating an investment after maturity would require a future available rate, fresh dates and additional assumptions. This calculator makes no such forecast.
Insert actual fees and deductions
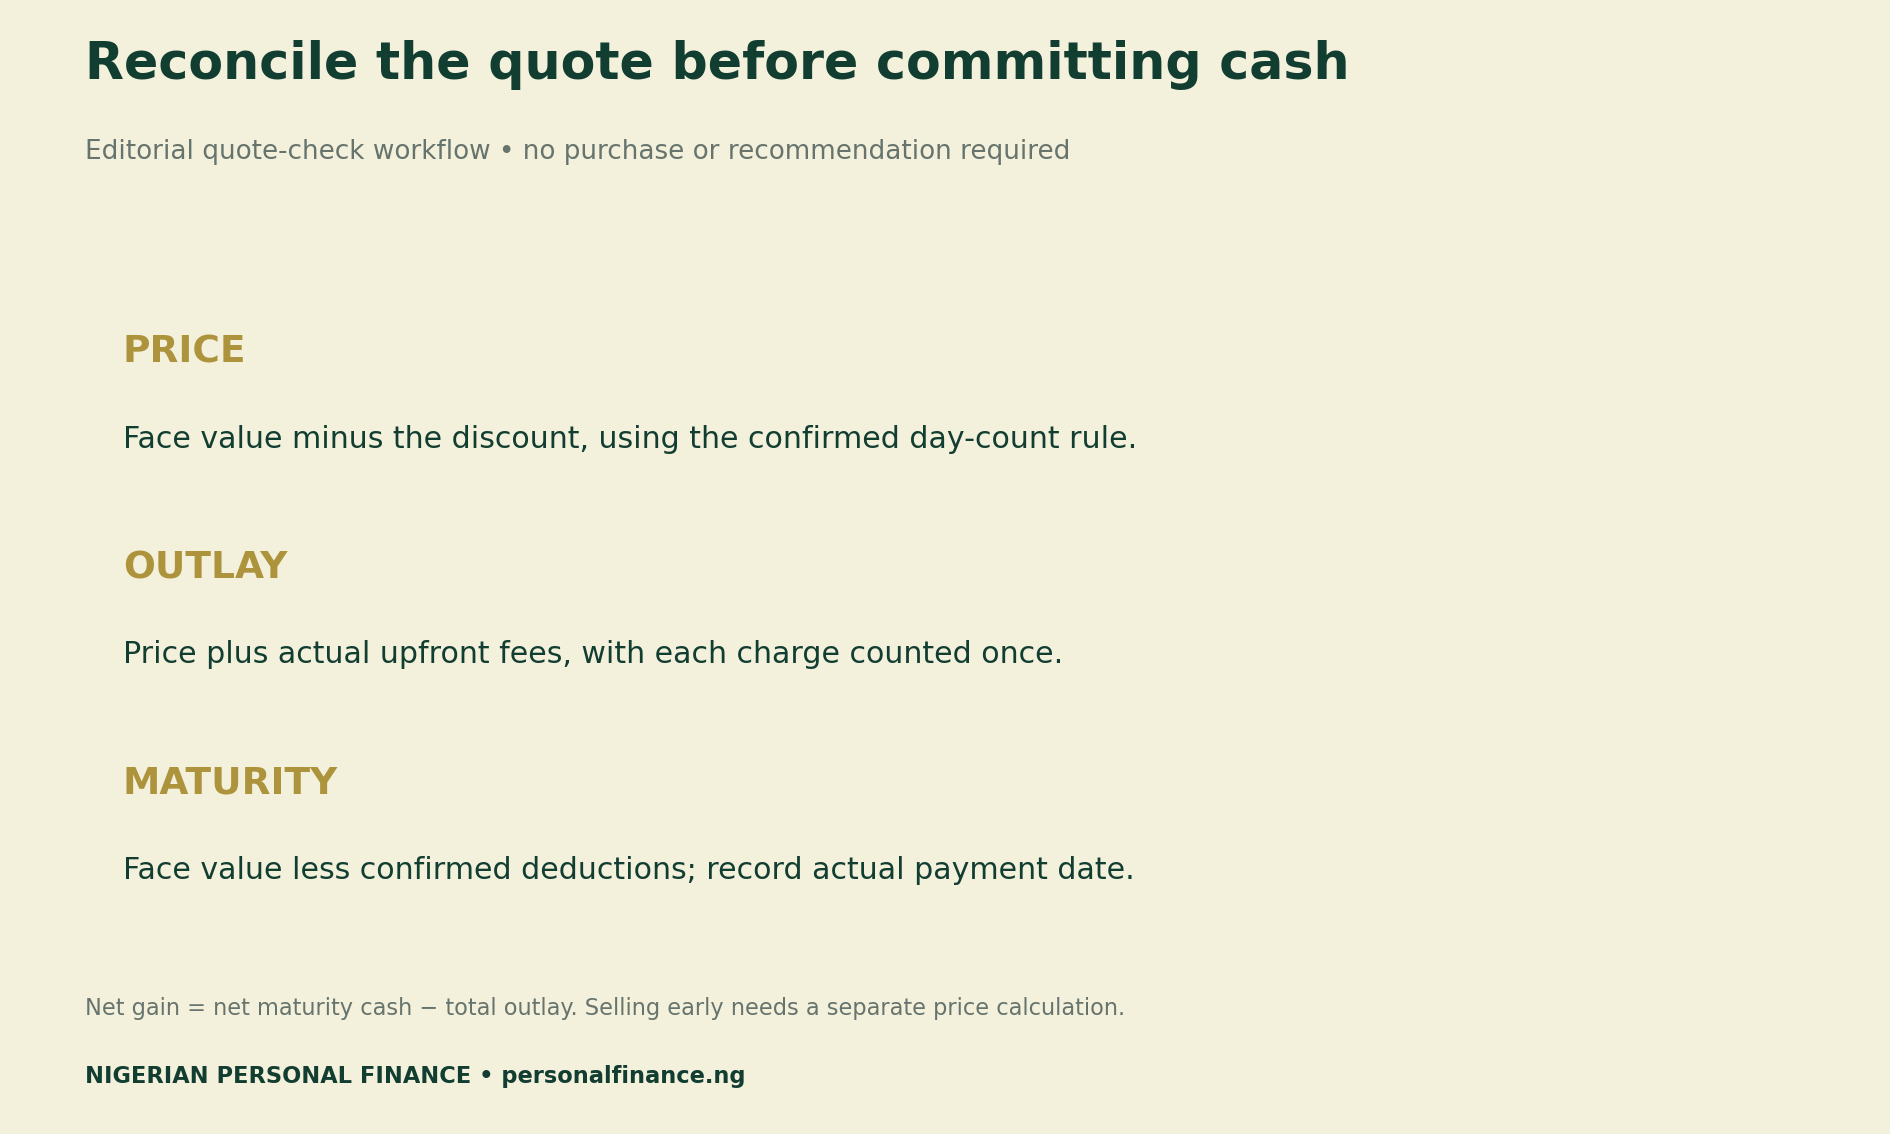
Use total outlay rather than the pre-fee price when calculating the return you expect on money leaving your account. Our general reconciliation is: outlay = price + upfront fees; net maturity cash = face value − maturity deductions; net gain = net maturity cash − outlay.
Next, divide net gain by outlay for the holding-period return, provided outlay is positive. A negative net gain should remain visible as a loss. The spreadsheet leaves results unavailable when required inputs are missing. A deliberately entered zero fee is an assumption you can inspect, not proof that fees are universally absent.
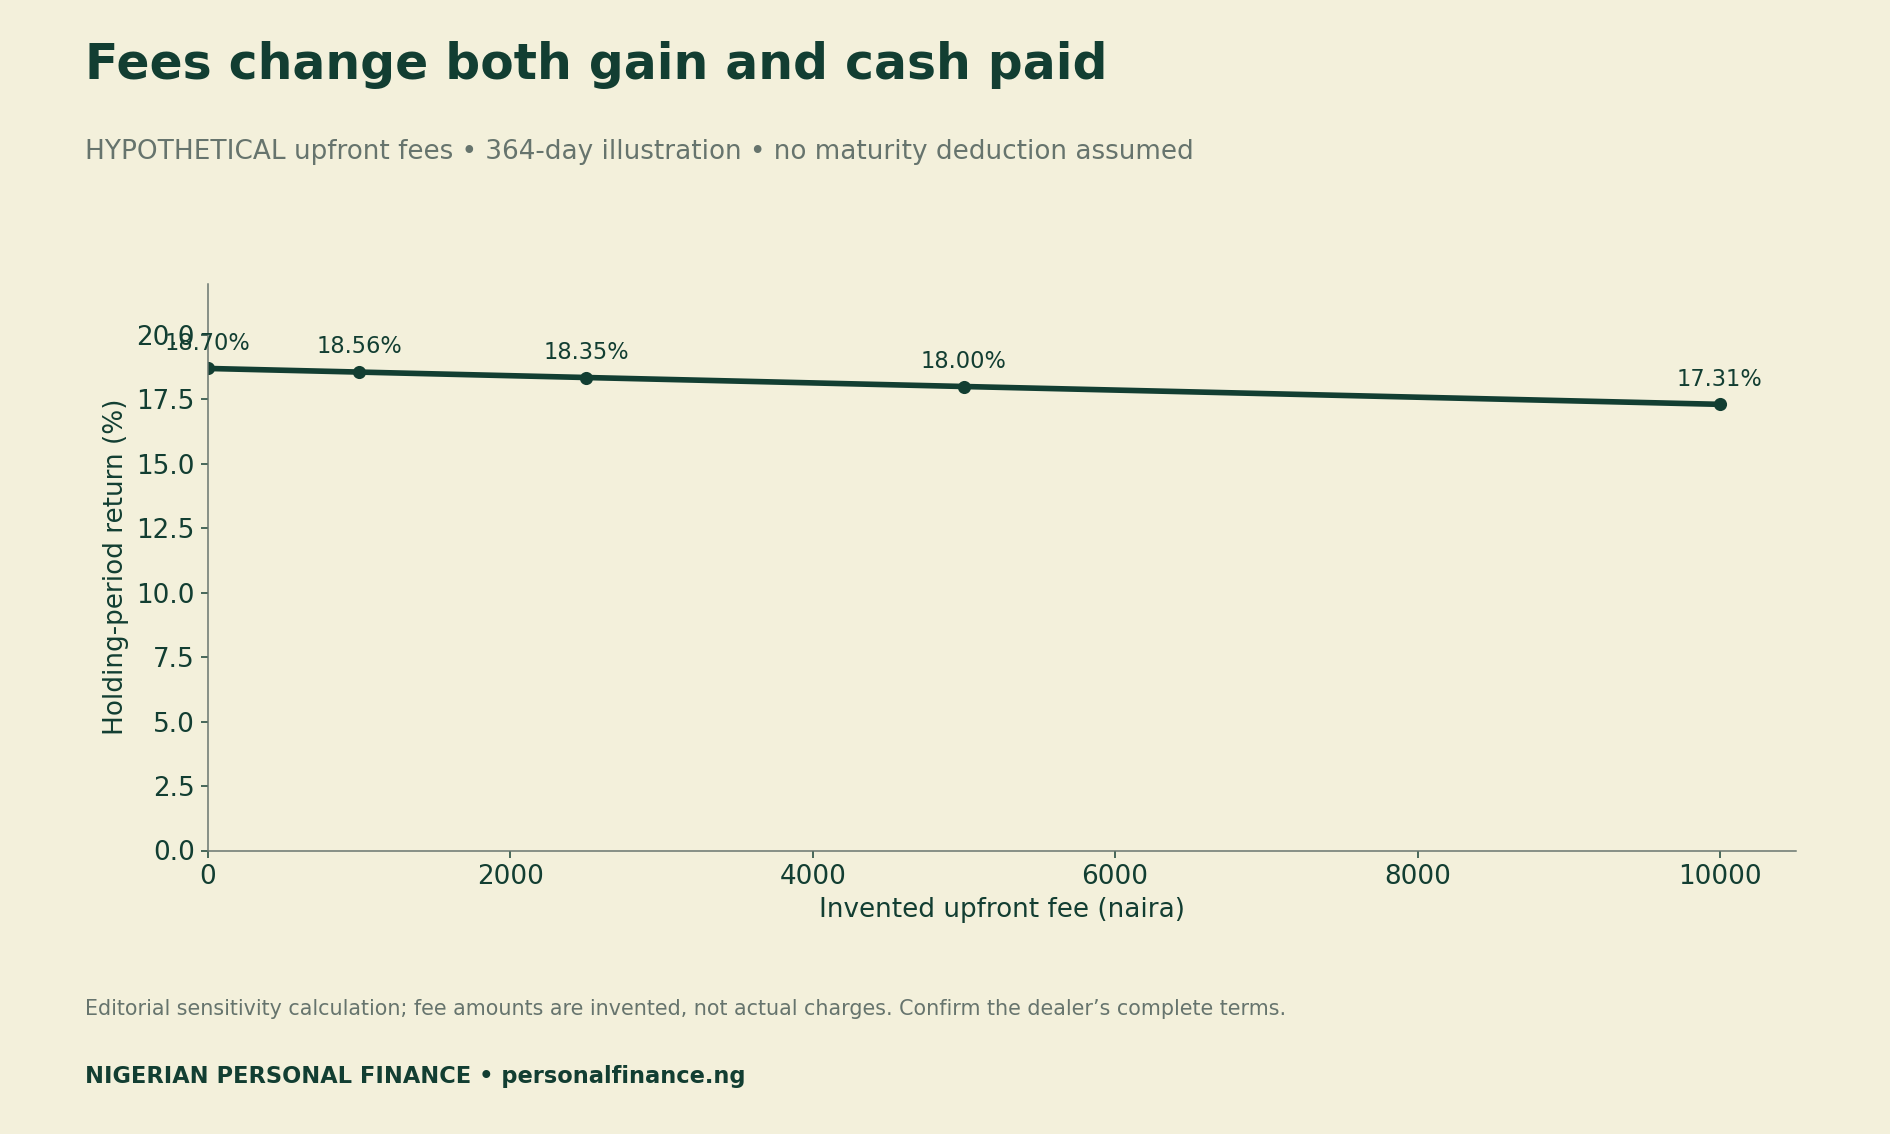
In the 364-day example, an invented ₦10,000 upfront fee raises outlay to ₦852,432.88 and reduces net gain to ₦147,567.12. The resulting period return is about 17.31%. No maturity deduction is assumed in that scenario. Actual charges could have different amounts or timing.
Do not infer a tax exemption, universal withholding rate or minimum investment from these examples. Ask for the dealer’s applicable terms. A dealer’s own Treasury-bill product page illustrates why access and charge details belong to the specific provider; its terms are not treated here as market-wide rules.
Your Personalized Financial Plan
Get expert financial advice tailored exclusively to your goals. Receive a custom roadmap in just 1-3 business days.
Get Started
Use the editable Treasury bill calculator
Editable discount calculator (XLSX) contains the three historical-rate examples with formula cells. Blue input cells hold face value, rate, days, base, upfront fees and maturity deductions. The zero-fee and zero-deduction entries are explicit illustration assumptions. Replace them with confirmed figures.
The workbook calculates discount, price, outlay, net receipt, net gain, holding-period return and simple annualisation. It also checks that price plus discount reconciles to face value. Use positive face value, days and day-count base, and keep the purchase price and total outlay positive. The sheet is not a suitability assessment or an early-sale pricing tool.
Worked calculation data (CSV) preserves unrounded inputs and outputs for all three tenors. This plain table is useful for reproducing the figures in your own software. It does not recalculate when a cell changes.
Blank dealer-quote worksheet (CSV) records timestamps, expiry, rate labels, dates, charges and unresolved terms. Keep private account details off any copy used for public discussion. The website does not collect completed worksheets.
Fictional fee-sensitivity data (CSV) contains the five invented fee cases behind Figure 4. Use it to check the arithmetic, without treating it as a survey of provider prices.
Match settlement and maturity to the household plan
Write down the expense the money may need to cover and its actual due date. Then ask whether the quoted settlement and maturity dates fit that need. A headline tenor by itself does not confirm a personalised payment calendar. Check the dates on the written quote.
If you may need to sell before maturity, request a separate explanation of early-sale pricing and charges. The maturity illustration cannot predict that sale price. Likewise, a maturity receipt should not be counted as new income equal to its whole face value: much of it returns the money originally invested.
For account-opening background, see our existing guide to investing in Nigerian Treasury bills. Our retirement paperwork and healthcare cash checklist addresses another household planning task. This article focuses on auditing a quotation’s arithmetic rather than repeating general investing steps.
Method, checks and limitations
We transcribed three historical stop rates from AIICO’s dated original report and retained the source privately for verification. The report is linked, not republished. The source provides a market-participant account; we did not independently download an official auction return or execute a customer transaction.
All worked outputs use ₦1 million face value and actual days divided by 365. We retained full precision until display rounding. Price plus discount reconciles to face value for all three examples. The spreadsheet was recalculated and checked after a changed-fee case, a zero discount rate and a missing input. Native Excel application behaviour was not separately tested.
The fee chart uses invented inputs and does not establish prevailing fees. The results do not assume reinvestment, compounding, inflation or tax exemption. They offer no liquidity guarantee or suitability finding. Obtain current confirmed terms for any real decision. Corrections log: initial source, formula and visual checks completed on 30 October 2026.
Suggested citation: Nigerian Personal Finance, “Nigeria Treasury Bill Calculator: Check October 2026 Discount Rates,” 30 October 2026. Identify the monetary outputs as our illustrations and cite AIICO’s 28 October report for the historical rate inputs.