






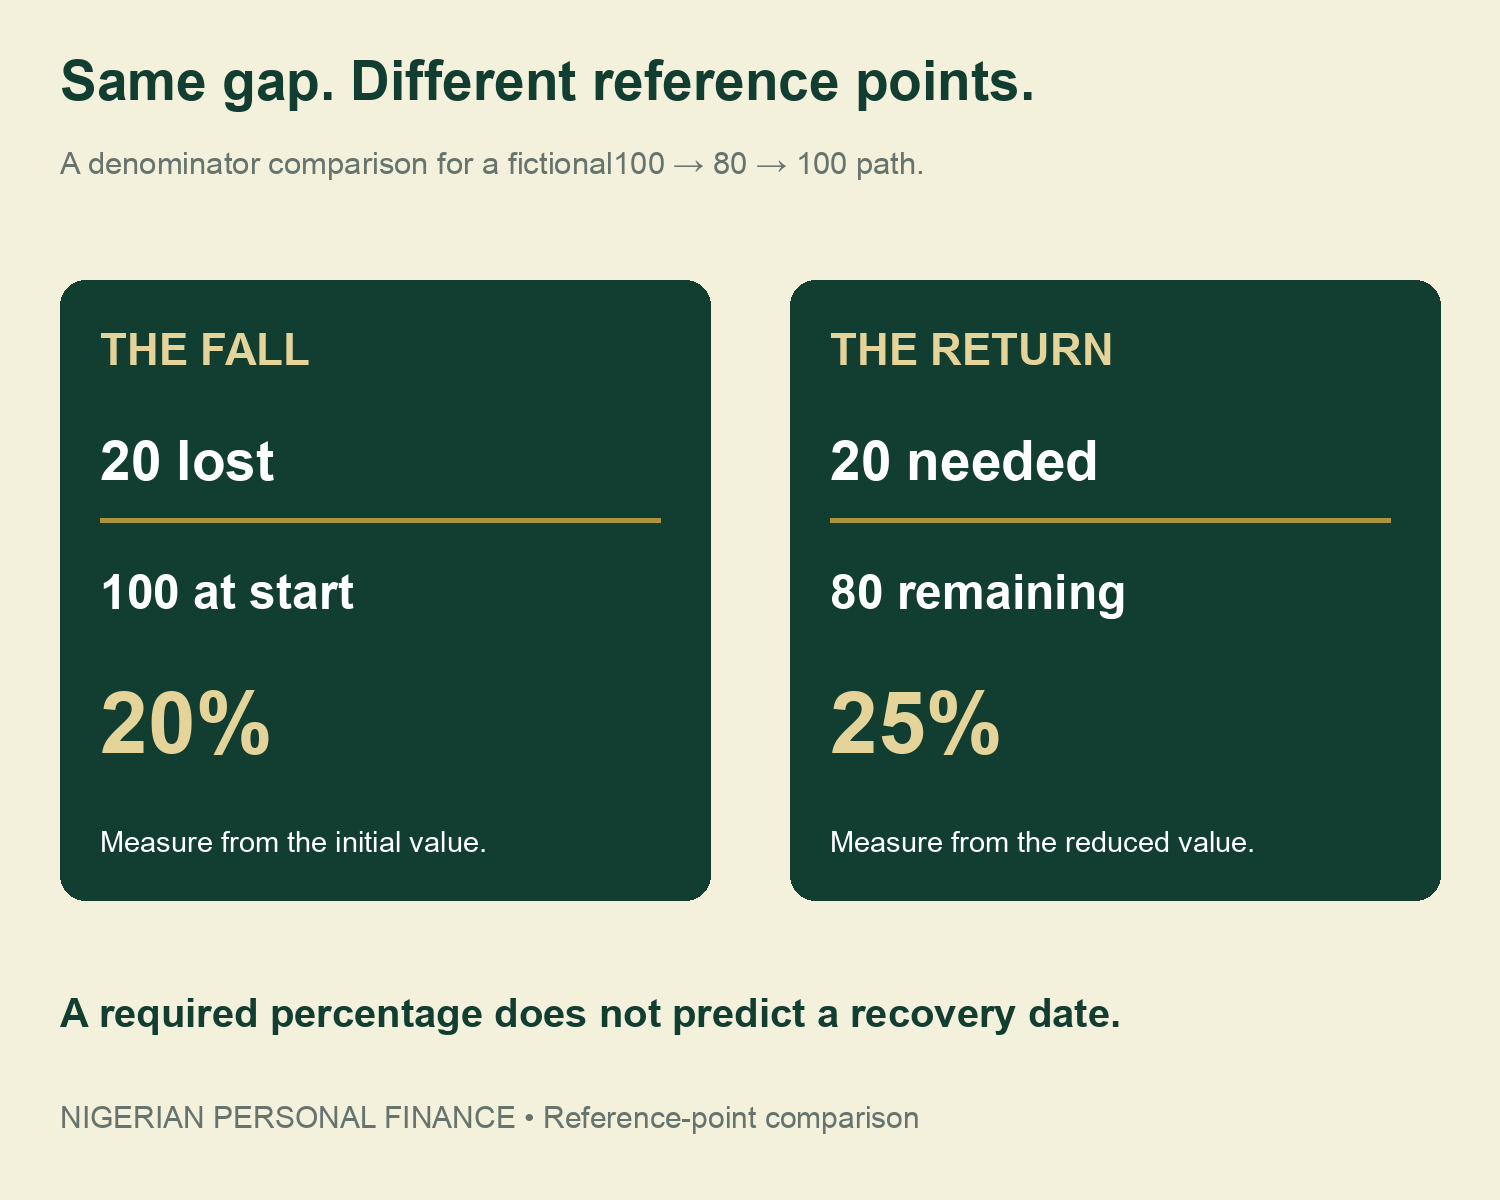
This NGX stock loss recovery calculator answers a precise question: what percentage change would take a current value back to a chosen target? It also shows the historical change from an initial value. The two calculations use different denominators, which is why a 20% loss needs a 25% gain to return to the start.
We use the exchange’s November 6 weekly report as a dated example, then separate it from a fictional household holding. Three charts, a reference-point infographic and four downloadable CSV tools make the arithmetic reproducible. The calculator predicts neither a rebound nor a date. It is not a buy, sell or hold recommendation.
A negative week can sit inside a positive year
The NGX report released 6 November 2026 covers the week ended that day. Its page 3 puts the All-Share Index at 254,299.49 on 30 October and 248,877.22 on 6 November. The reported weekly change is −2.13%, while the year-to-date change is +59.93%. Those percentages use different reference dates and do not contradict each other.
The same page lists 29 rising equities, 57 falling and 60 unchanged. This breadth describes the report’s market comparison, not an individual’s account. A person’s holdings, purchase dates and cash movements can produce a very different result. A strong calendar-year index figure does not erase a household loss over another period.
We call this a weekly change, not a peak-to-trough drawdown. Identifying a drawdown needs an appropriate price history and a defined peak. The full exchange-authored PDF, hosted by Mondo Visione, is retained with our research. Its release date and observation window remain visible in the downloadable extract.
Use the NGX stock loss recovery calculator
Enter initial, current and target values in the same unit. For simple price-only break-even, set the target equal to the initial value. For another target, keep its meaning explicit. The tool runs in your browser and does not ask for an account number, login, portfolio upload or payment.
Loss and recovery calculator
Same unit throughout. Price/value arithmetic only; no cash flows, distributions or costs.
Historical change: −20.00%. Gain to target:25.00%. Gap to target:100,000. No recovery is guaranteed.
Historical change=(current÷initial−1)×100. Change to target=(target÷current−1)×100. Initial and target values must be positive; current value can be zero. A zero current value cannot reach a positive target through any finite percentage gain. The tool displays that limit instead of dividing by zero.
If the current value already meets or exceeds the target, no additional gain is needed. A negative change-to-target describes movement down to a lower target, not a required gain. It should not be presented as a trading instruction. The gap is a simple target-minus-current amount in the unit you entered.
Why a 20% fall needs a 25% gain
Start with 100 units. A 20% fall removes 20 and leaves 80. To return to 100, the remaining 80 must gain 20. Thus 20÷80×100=25%. If the loss is 50%, the remaining 50 needs another 50, or 100%. The same absolute gap is larger relative to a smaller base.
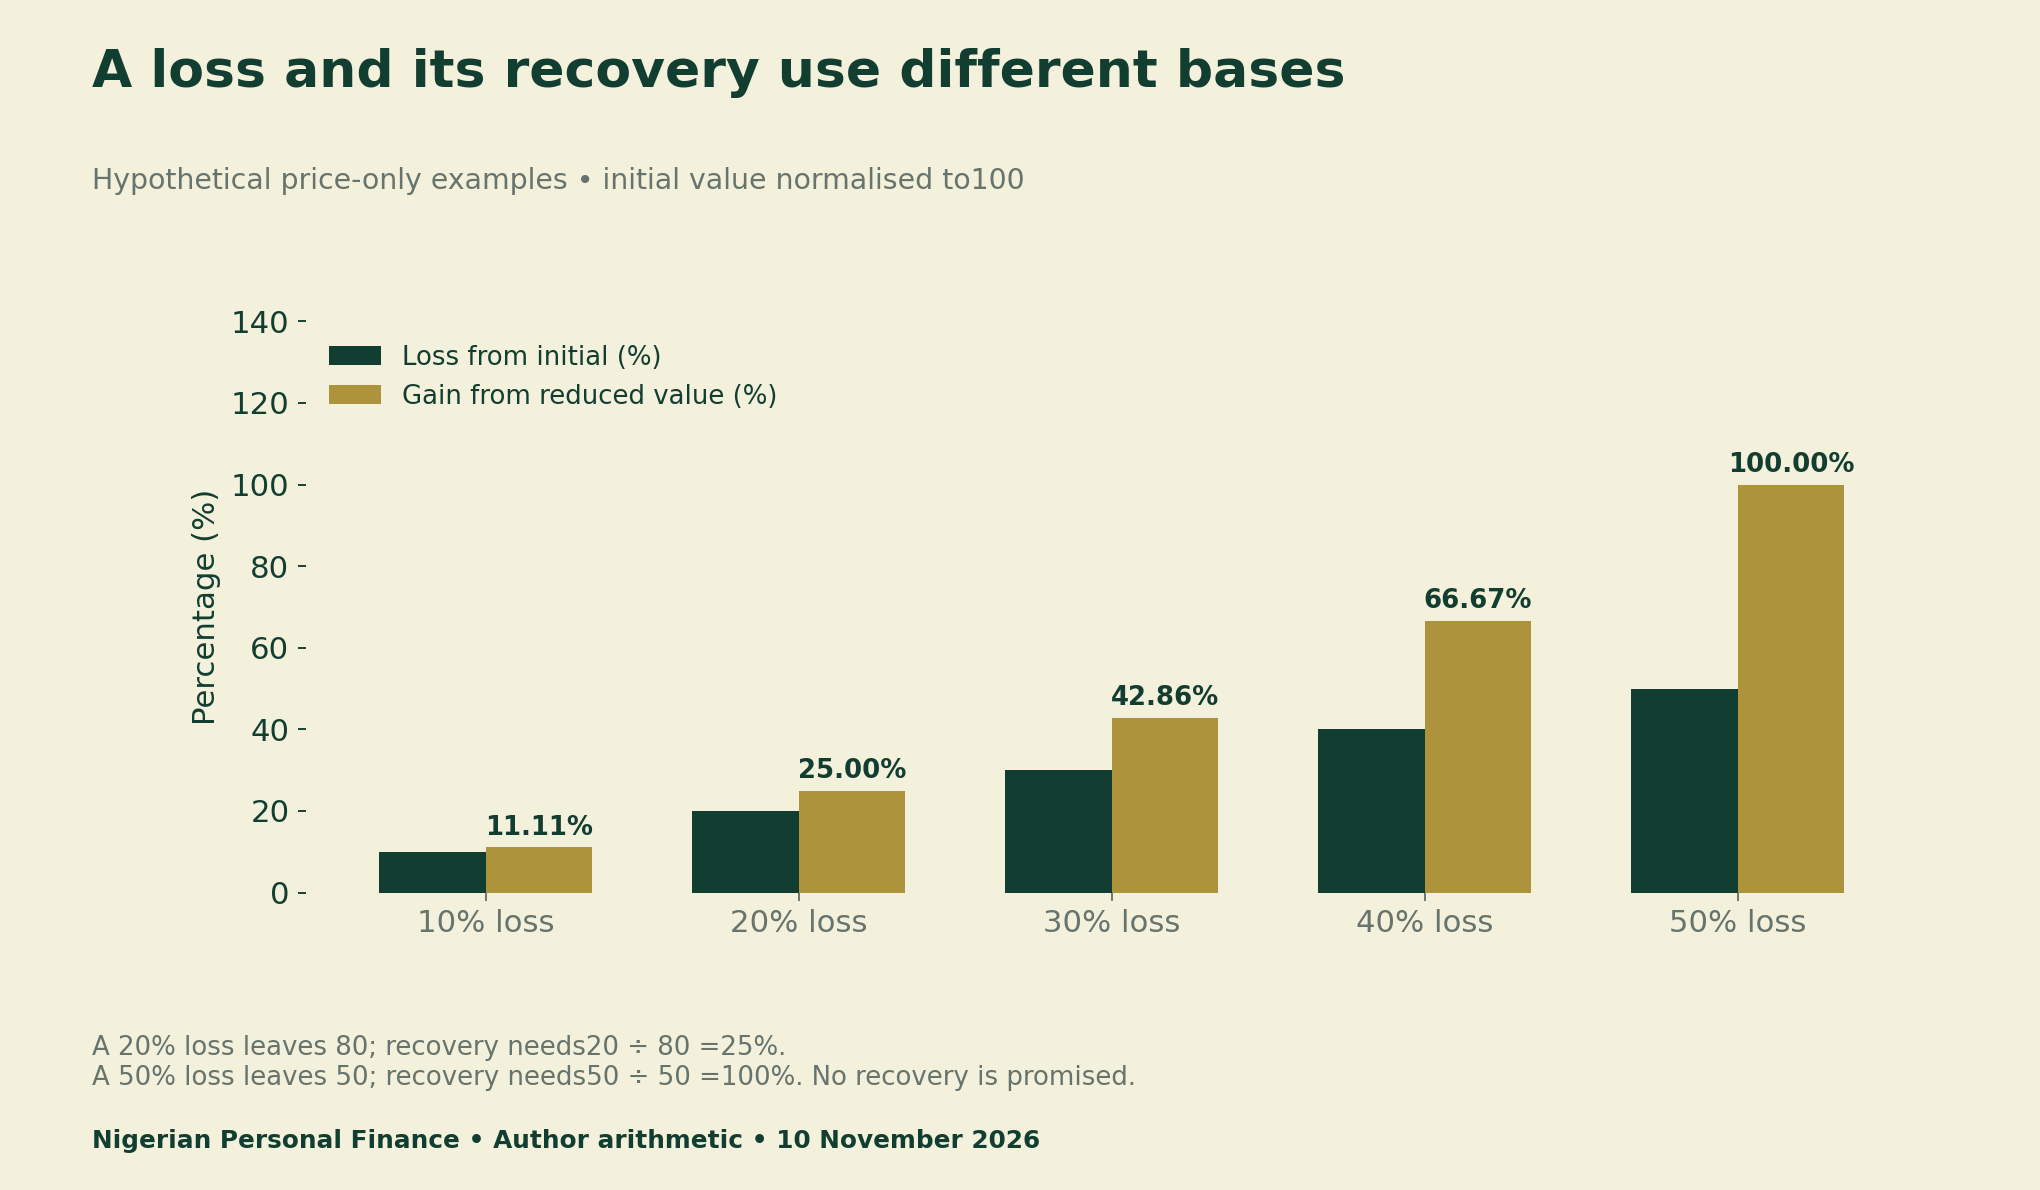
The relationship is loss÷(1−loss), with the loss expressed as a fraction below 1. This is a mathematical relationship, not a rule that prices must follow. A required return may be large, and an investment may never regain its previous price. Knowing the arithmetic does not establish its future prospects.
Work through the November 6 NGX levels
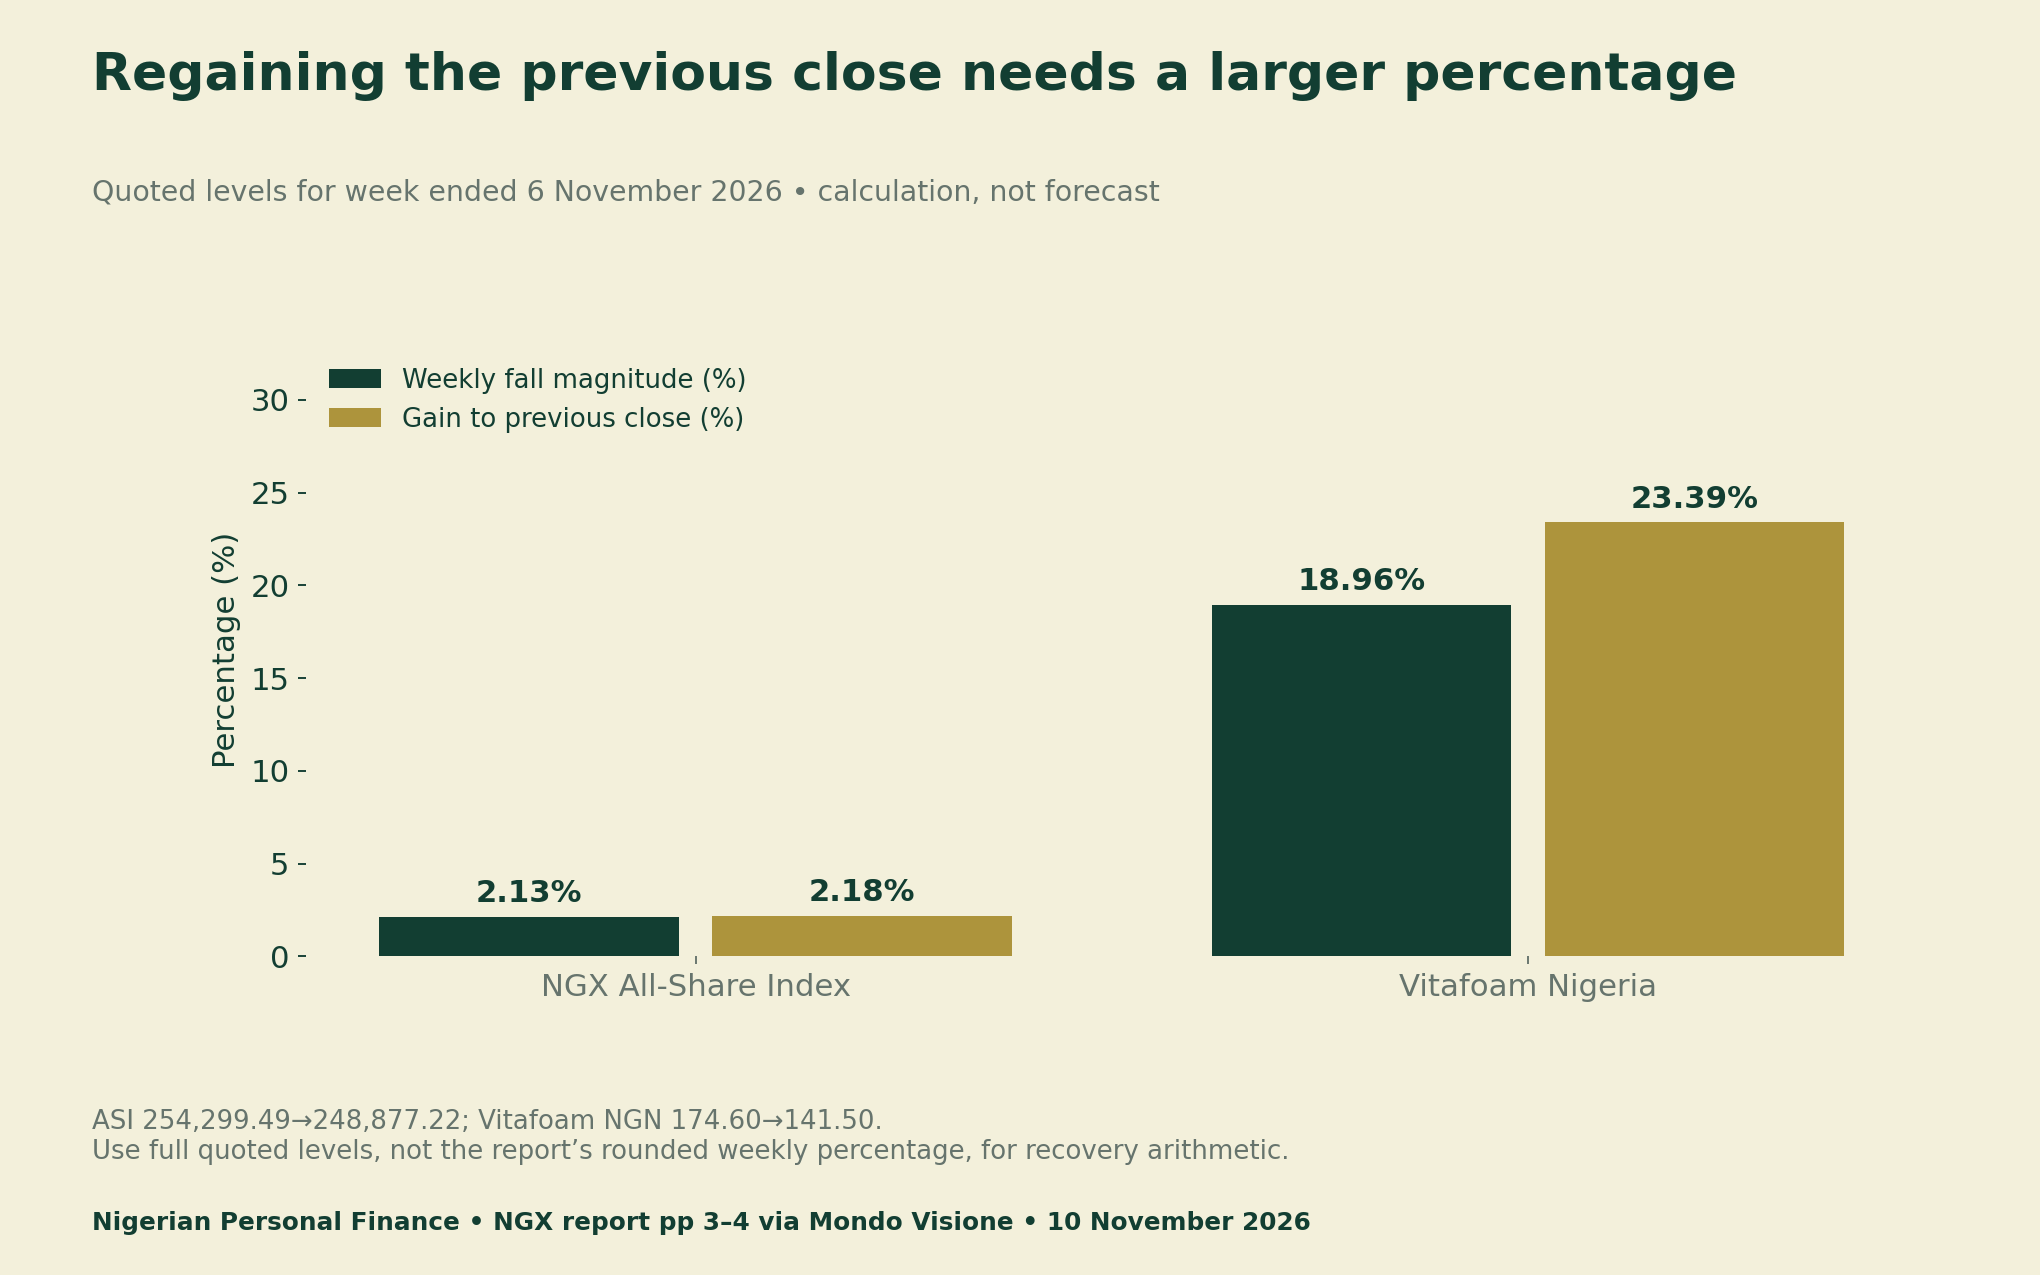
Using the unrounded quoted index levels, 248,877.22÷254,299.49−1 gives approximately−2.13%. Reversing the ratio gives 254,299.49÷248,877.22−1, or about+2.18%. The latter is the gain needed from that particular close to reach the previous close. It is not a forecast or an estimate of a household return.
Page 4 lists Vitafoam at ₦174.60 before the week and ₦141.50 at the close, a reported fall of 18.96%. To regain ₦174.60 from ₦141.50 requires 174.60÷141.50−1, or about 23.39%. These are quoted-price calculations. We have not adjusted a personal holding for dividends, corporate actions or transaction costs.
A fictional ₦500,000 holding shows the cash gap
Suppose an invented ₦500,000 holding falls 20% to ₦400,000. A later 20% rise adds ₦80,000, reaching ₦480,000. It remains ₦20,000 below the original amount. The first 20% applied to ₦500,000; the second applied to ₦400,000. Equal percentages did not cancel.
Your Personalized Financial Plan
Get expert financial advice tailored exclusively to your goals. Receive a custom roadmap in just 1-3 business days.
Get Started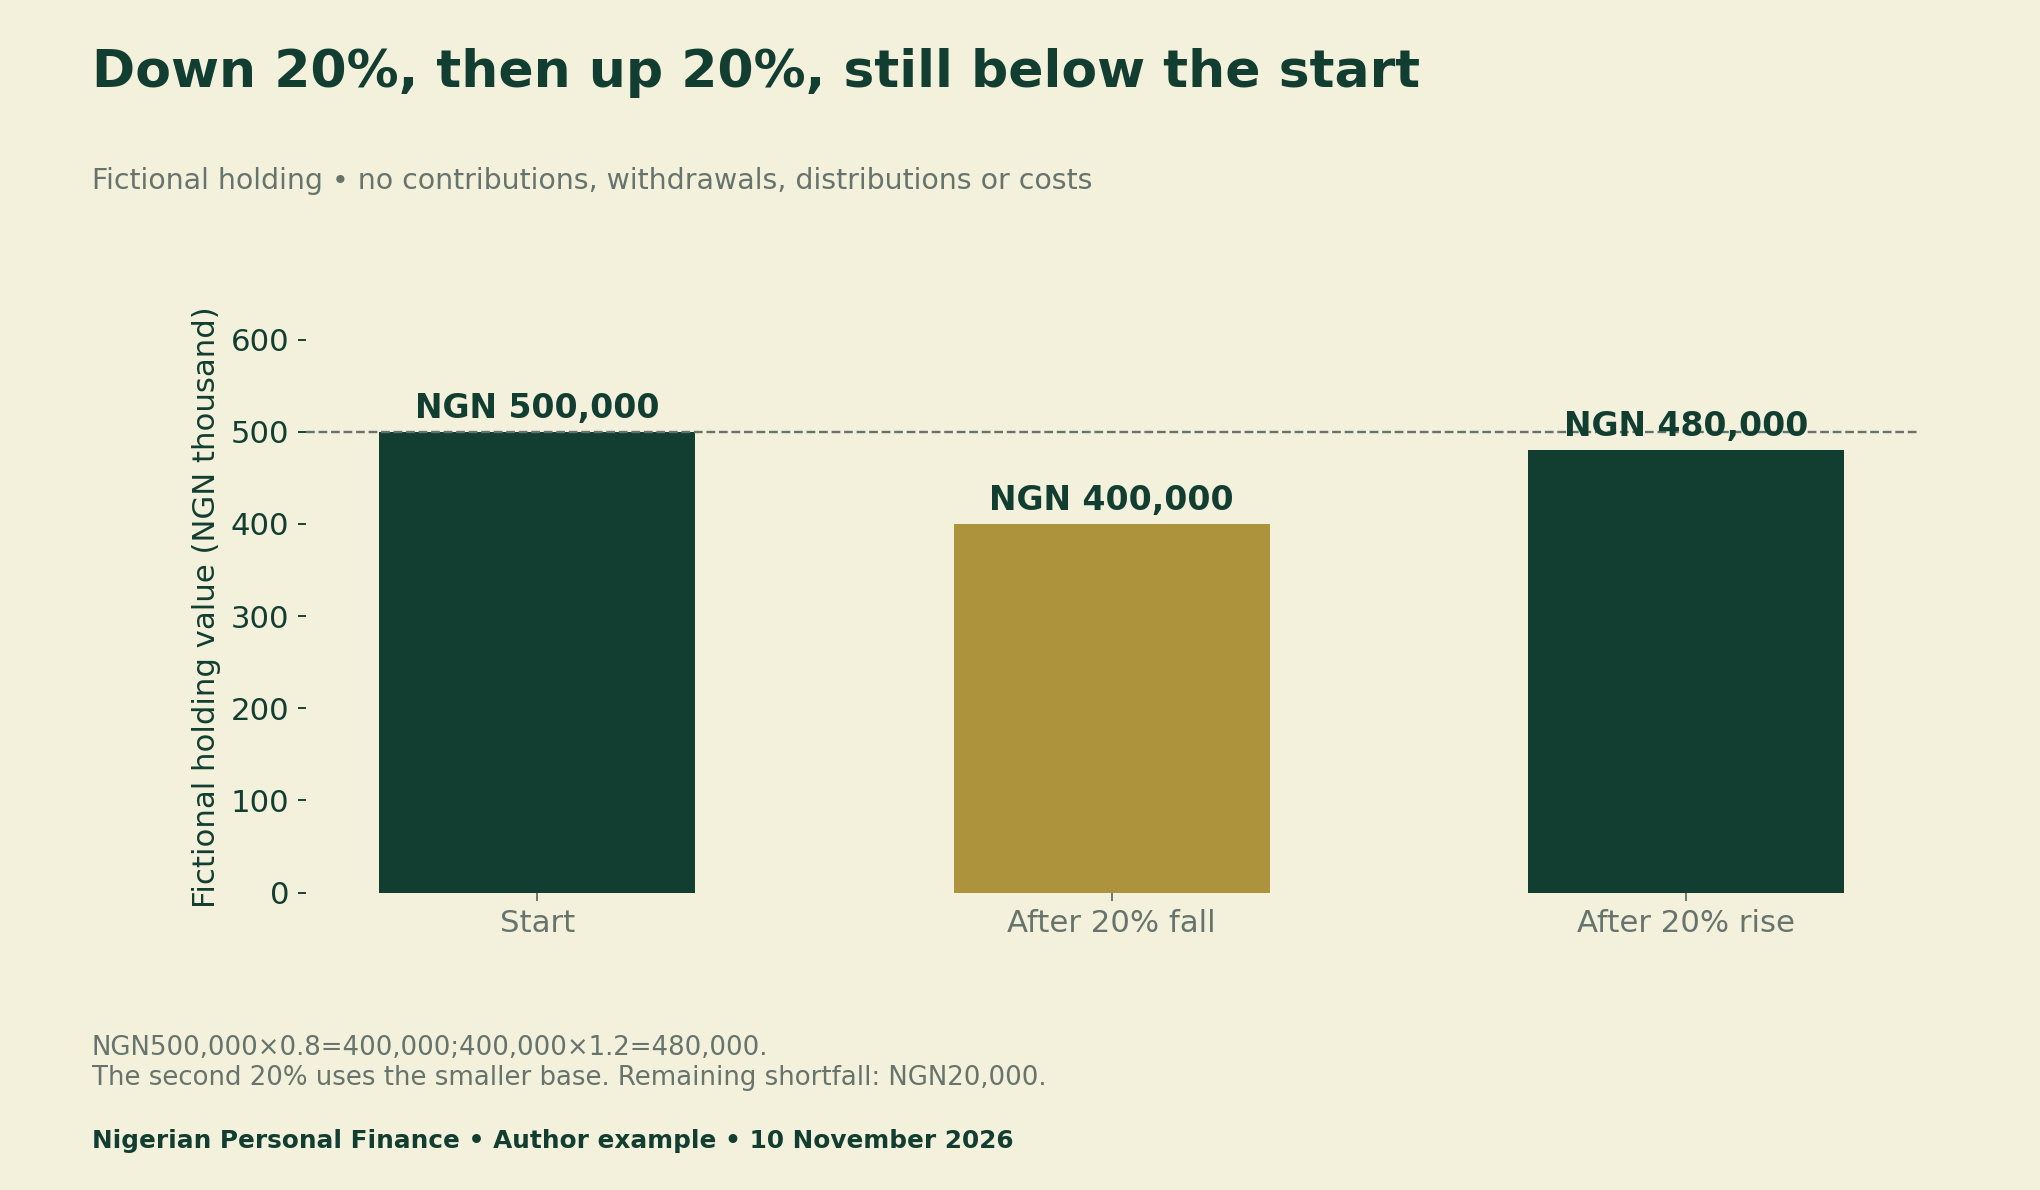
The next gain needed from ₦480,000 to ₦500,000 is about 4.17%, using the new current value. Recalculate from the correct point rather than adding historic percentage changes. If fresh contributions or withdrawals occurred, that simple path would no longer isolate investment performance.
Price recovery is not total-return break-even
Dividends, fees, taxes and cash flows can alter the economic result. Splits, bonus issues and other corporate actions may require price adjustment before a quoted fall is treated as a loss. Inflation also changes purchasing power. The NGX stock loss recovery calculator deliberately leaves these inputs out so its boundary stays clear.
For account cash flows, our mutual-fund NAV and investor-return guide explains why a change in assets is not automatically an investment return. For asset composition, the pension look-through report addresses another question. Neither should be substituted for this price-only calculation.
Separate a spending deadline from a market target
Write down the amount required, its due date and cash available outside the investment. Then compare several explicitly hypothetical asset values without assigning probabilities from one week’s market result. The private goal sheet keeps those fields separate. A percentage needed to recover cannot tell you whether money will be available when a bill falls due.
A household decision needs its wider circumstances and, where appropriate, advice from a properly regulated professional. This article does not recommend panic selling, buying a dip or keeping a security until it breaks even. The original purchase price is a useful accounting reference, but it does not determine an investment’s future value.
Download the source, examples and private goal sheet
- NGX November 6 source levels and calculations (CSV)
- Loss and recovery worked examples (CSV)
- Blank private investment goal sheet (CSV)
- Loss recovery method dictionary (CSV)
Method and update log
Research checked 10 November 2026. We retained the five-page exchange-authored weekly PDF from its Mondo Visione mirror and visually checked pages 3–4. The release is dated 6 November; the market comparison runs from 30 October to 6 November. We use the full quoted levels and round calculated percentages only at display.
The calculator and fictional examples share the published formulas. They contain no return forecast, recovery deadline or personalised portfolio data. Suggested citation: Nigerian Personal Finance, “NGX Weekly Losses: Calculate the Gain Needed to Break Even,” 10 November 2026. Cite NGX for the dated source levels and this report for the reproducible arithmetic and tools.


