






Nigerian pension fund asset allocation tells you what sits beneath an account balance. It also helps you see whether government securities appear in more than one part of a household’s finances. A pension account and a direct bond holding have different names, but some underlying exposure can overlap.
This report separates the new OECD research, PenCom’s older August snapshot and a wholly fictional household calculation. It includes three charts, a measurement-hierarchy infographic and four free CSV tools. It does not estimate your personal allocation, forecast returns or recommend switching a pension fund.
A new OECD report is not a new personal portfolio
The OECD’s Africa Capital Markets Report, published 6 November 2026, discusses Nigeria’s concentration in domestic fixed income. Its approximate 70% bonds-and-bills statement draws on older PenCom evidence. The observations vary across the report’s figures and panels. A November publication date does not make every underlying observation a November measurement.
For a more recent Nigerian portfolio snapshot, we use PenCom’s unaudited report for the period ended 31 August 2026. The Commission listed the release on 28 September. Its “Total FGN Securities” is a specific asset category, while bonds and bills is a broader description. Therefore, the OECD’s approximate 70% and our August 55.97% calculation are not a like-for-like trend.
Do not subtract those percentages and say households reduced government exposure by the difference. That would mix dates, categories and source coverage. Instead, preserve each definition and denominator. The source-comparison download makes the mismatch visible so that another writer can check it before reusing a number.
Read PenCom’s units before calculating the share
The official August portfolio table reports amounts in naira millions. Total FGN securities are ₦17,801,087.15 million, against total current net asset value of ₦31,802,243.65 million. Divide the first by the second and multiply by 100: the result is 55.97%, rounded to two decimal places. Both inputs use the same unit.
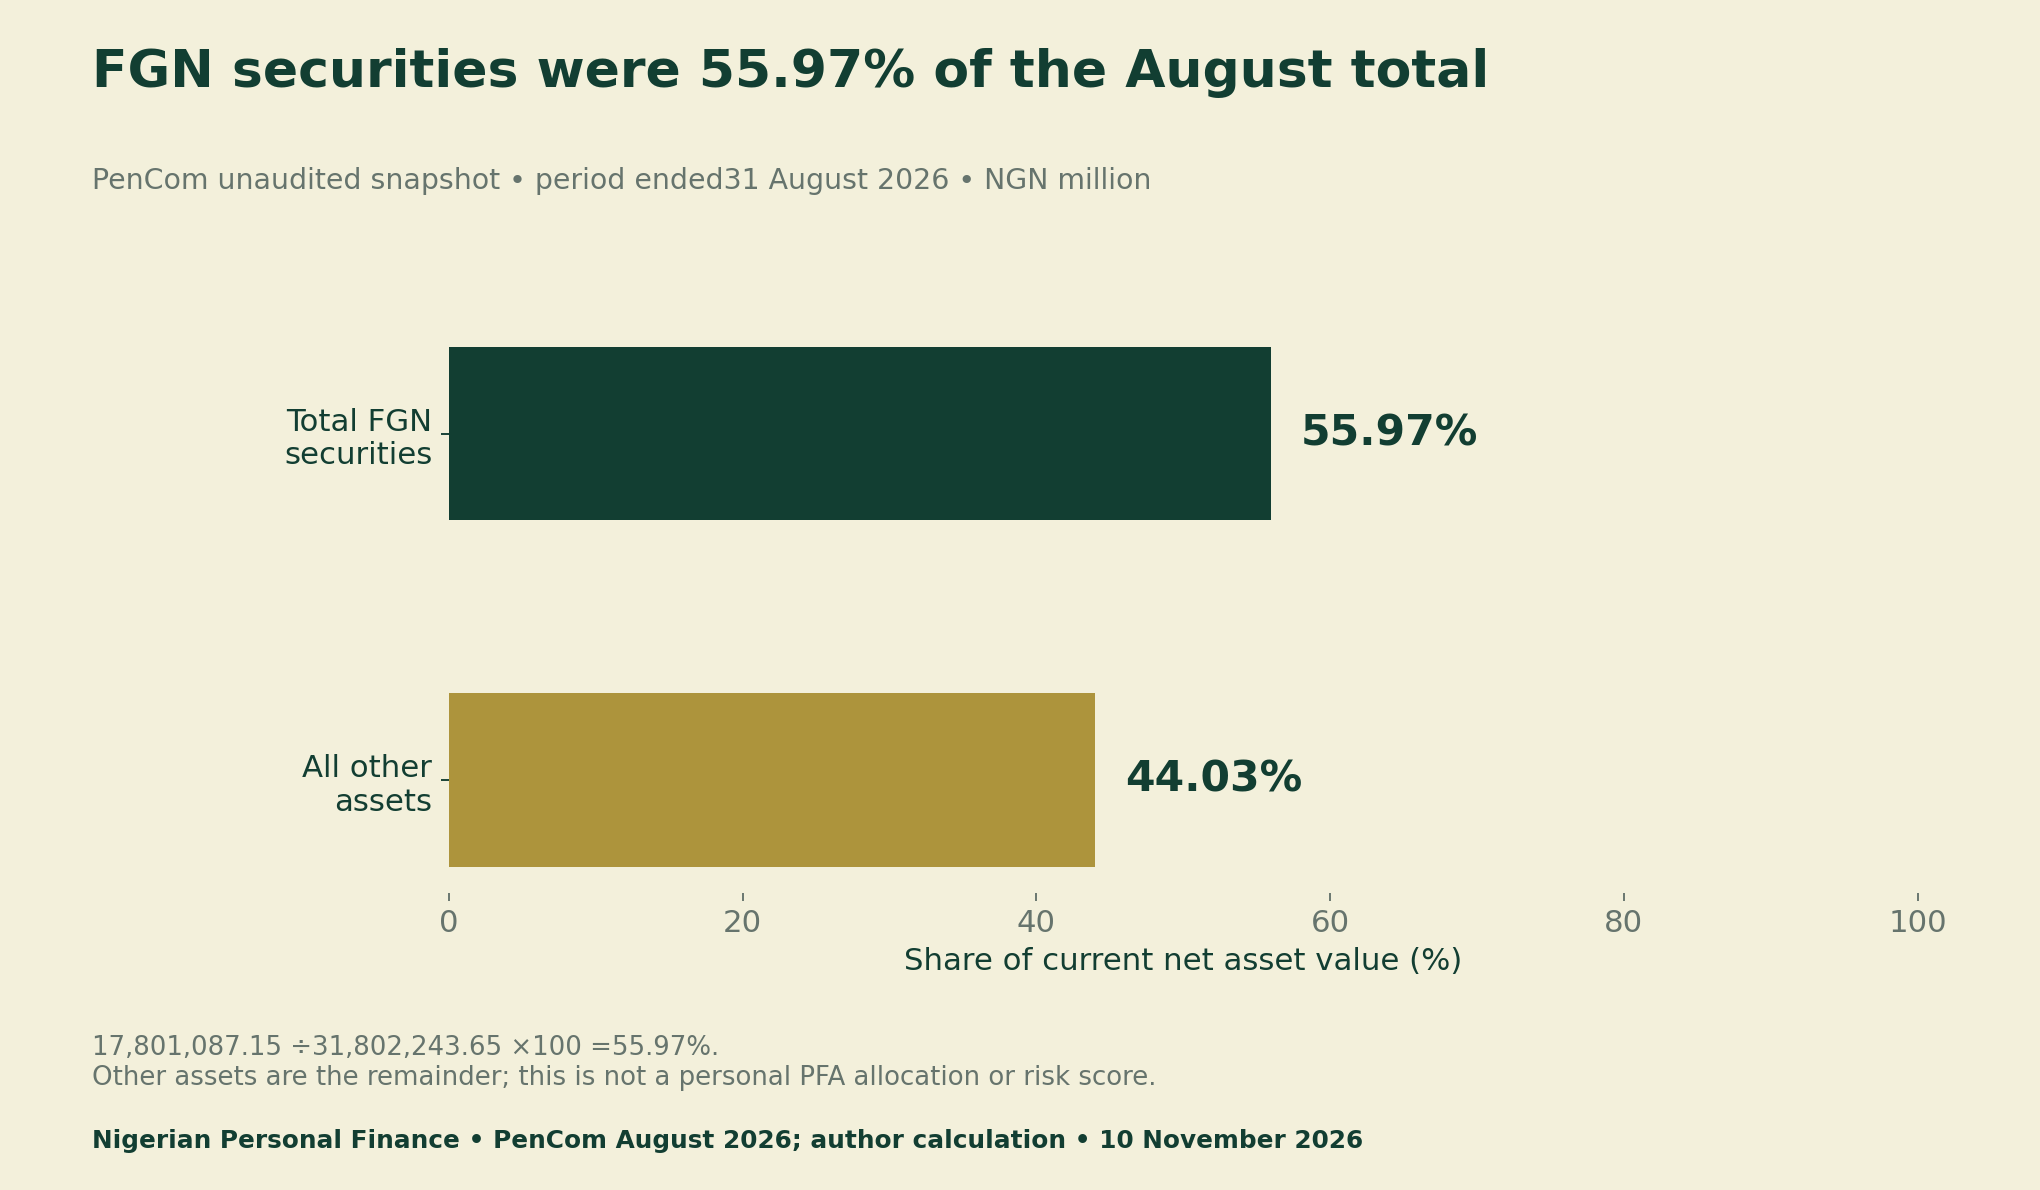
A million-naira unit means the total is about ₦31.80 trillion, not ₦31.80 million. Preserve the original unit in a data extract even when prose uses a shorter trillion figure. This avoids a million-fold mistake and lets a reviewer reproduce the share directly from the published column totals.
The table is an unaudited snapshot. It includes approved existing schemes, closed pension fund administrators and several RSA funds. Its title also includes unremitted contributions at the CBN and legacy funds. This coverage is part of the denominator; it should not disappear when the number is quoted as an industry allocation.
Nigerian pension fund asset allocation varies by fund type
Use the FGN-securities amount and current NAV within each fund column. For Fund II, ₦6,556,069.63 million divided by ₦13,453,725.06 million gives 48.73%. Fund III gives 65.38%, and Fund IV gives 69.48%. These are aggregate fund-type shares at the same observation date, rather than the portfolio of any named pension administrator.
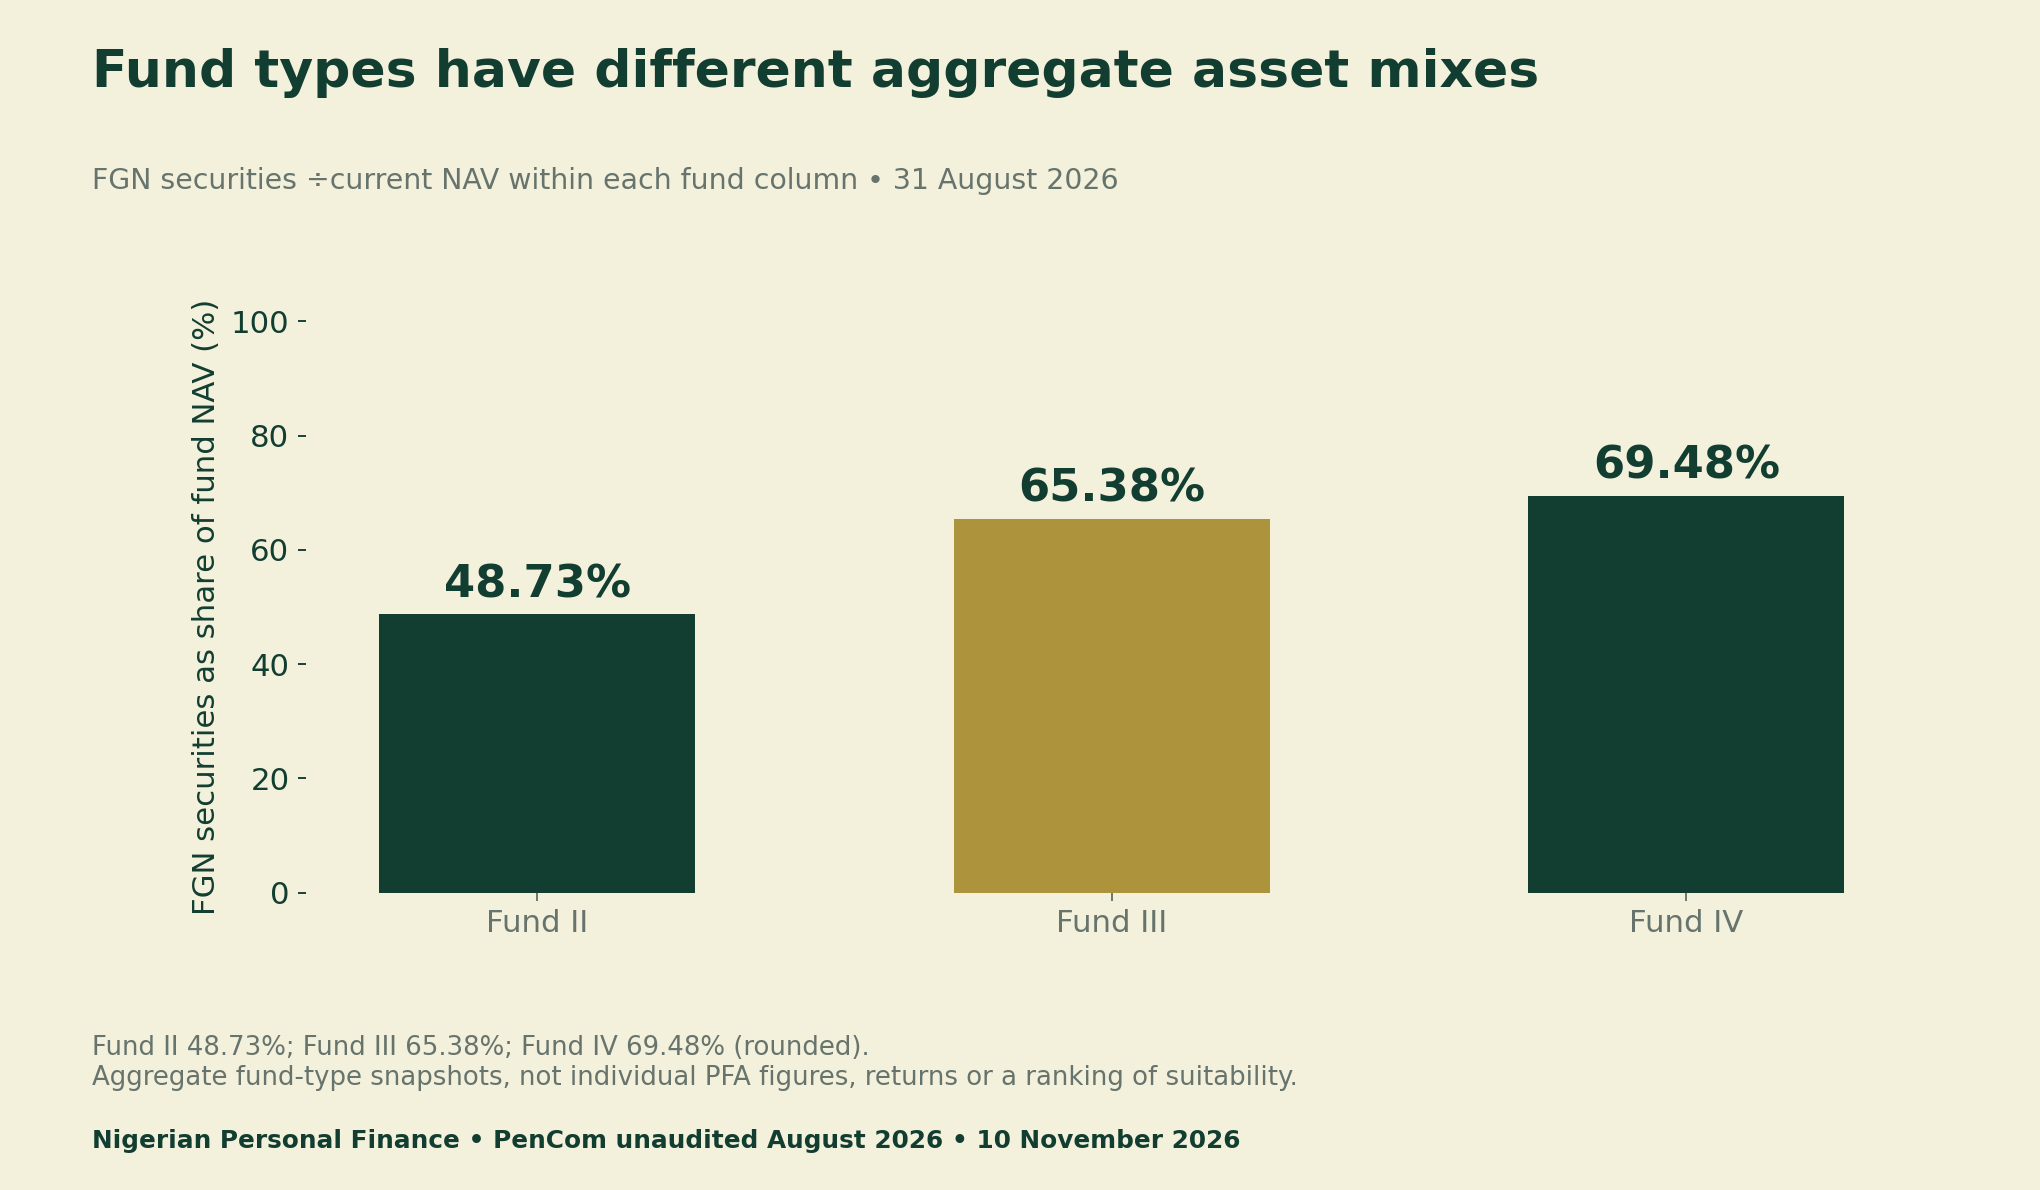
A lower government-security share does not automatically mean lower risk or better performance. Maturity, liquidity, valuation, inflation exposure and the other assets also matter. The chart does not evaluate those dimensions. Nor does a national fund-type mix establish what your own administrator held on a later date.
Check your pension fund asset allocation factsheet
To map Nigerian pension fund asset allocation at home, find the correct fund and the latest applicable factsheet from your own PFA. Record the factsheet date, the balance date and the exact asset classification. If the labels do not match, ask the administrator what is included. Do not fill the gap with the national 55.97% or an older online estimate.
Keep a missing allocation marked “unverified.” It is not zero. A household calculation built from incomplete weights should show the unclassified balance separately. It should not give a single precise total that quietly assumes the unknown part has no government-security exposure.
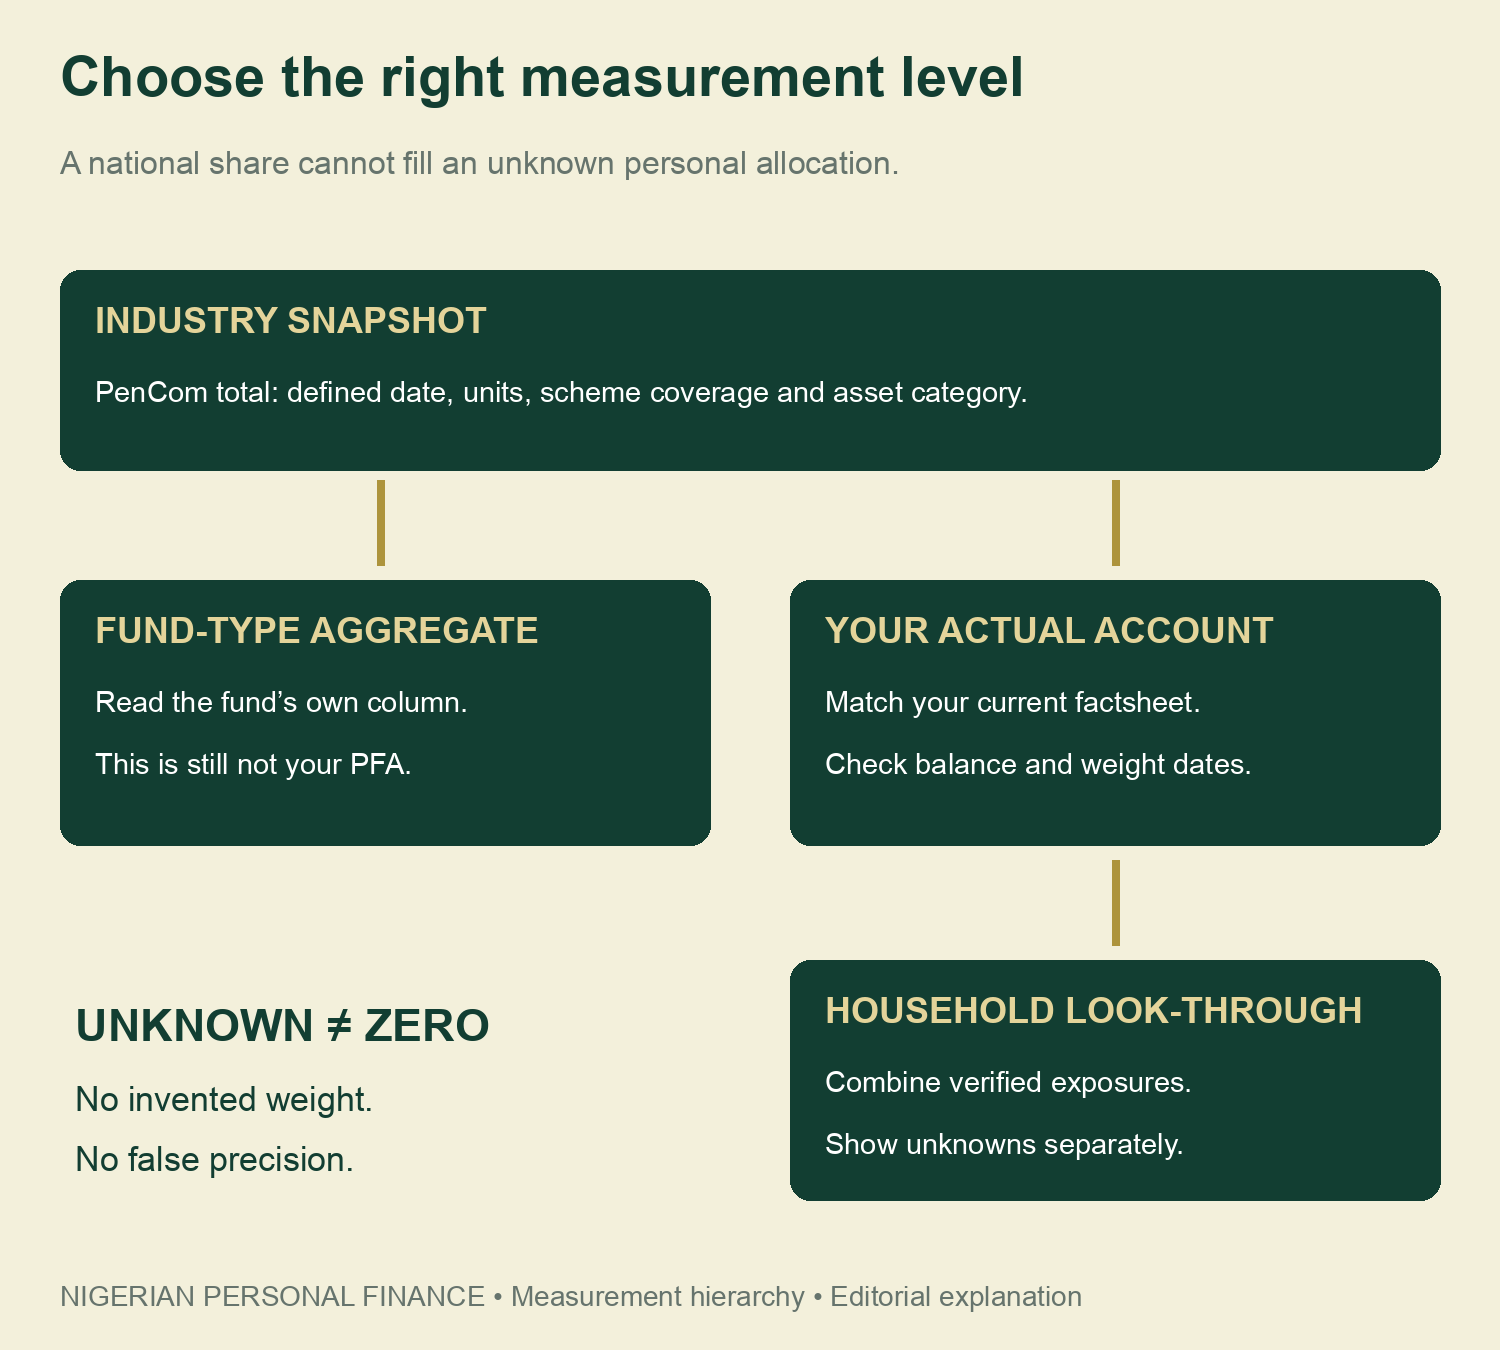
This is a direct asset-category look-through, not an estimate of every indirect economic link. For example, a bank deposit is classified here as bank cash. We do not look through the bank’s own balance sheet or claim that cash carries no risk. Define the boundary before adding the numbers.
A fictional household example makes overlap visible
Assume a wholly fictional household has ₦10 million in a pension account, ₦2 million in direct government securities and ₦1 million in bank cash. For the example only, assume the pension factsheet weight is 60%. That assumption is not PenCom’s national percentage and is not applied to a real saver.
The mapped pension exposure is ₦10 million×60%=₦6 million. Add the ₦2 million direct holding to get ₦8 million. The included financial assets total ₦13 million. Thus, ₦8 million÷₦13 million×100=61.54%. Keep the pension’s other ₦4 million and the cash in the denominator without pretending that they are the same asset.
Your Personalized Financial Plan
Get expert financial advice tailored exclusively to your goals. Receive a custom roadmap in just 1-3 business days.
Get Started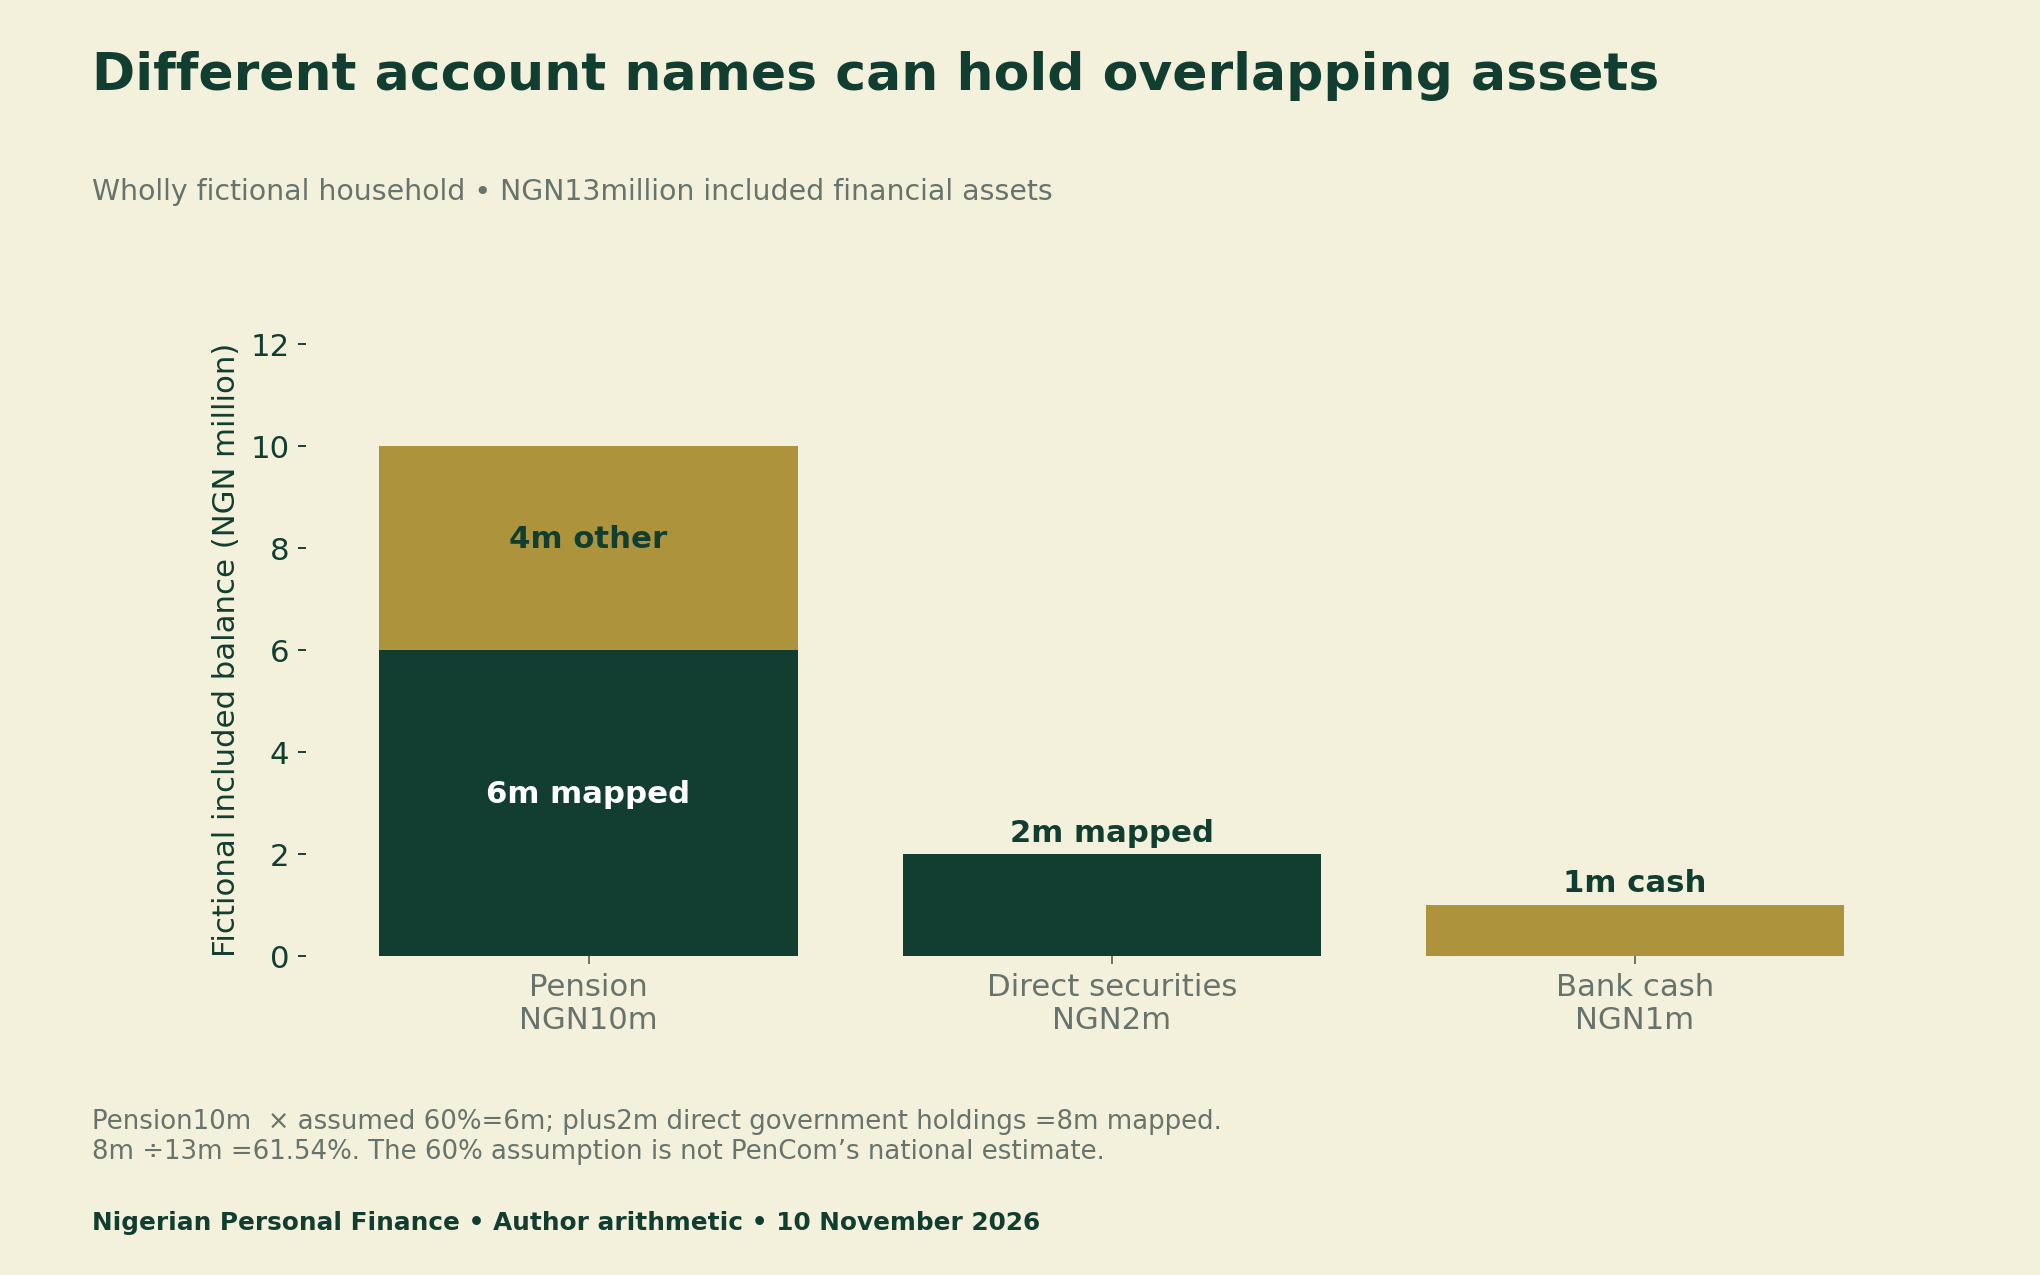
Avoid double counting. The ₦6 million beneath the pension is part of the ₦10 million pension balance, not an additional asset to add to the household total. Count each account balance once in the denominator, then map its verified exposure for the numerator. Keep dates and classification choices beside every input.
Use pension allocation data to ask better questions
Ask the PFA how it defines government securities, which date its weight covers and whether the relevant factsheet matches your fund. If you need advice, discuss the full financial position and goals with an appropriately regulated adviser. One concentration percentage cannot establish suitability, investment risk or the timing of future returns.
Our mutual-fund NAV and investor-return guide explains another measurement distinction: changes in aggregate assets do not automatically equal an individual’s return. This pension article addresses composition instead. A household needs both concepts, but they should not be merged into one performance claim.
We do not recommend withdrawals, bypassing access restrictions or switching funds from these charts. Eligibility and current rules require separate verification if a person is considering a fund choice. No reader should upload pension statements, account numbers or private balances to this website to use the tools.
Download the reproducible source and household tools
The source extract retains the original naira-million units and both ratio inputs. The comparison register preserves the OECD-versus-PenCom limitation. The fictional household file reproduces the arithmetic. The blank ledger lets you keep dates, unknowns and source references beside your own private figures.
- PenCom August 2026 allocation extract (CSV)
- Pension source-comparison register (CSV)
- Fictional household exposure arithmetic (CSV)
- Blank household look-through ledger (CSV)
Method, source access and update log
Research checked 10 November 2026. The fresh hook is the OECD’s 6 November report; August is older supporting Nigerian data. PenCom’s official landing page and September listing were checked in Chrome. The linked one-page table was read through the web document viewer. A direct binary download returned404, so the retained source extract records that access limitation rather than claiming a locally saved PDF.
All published-table ratios use current NAV in the corresponding column. Percentages are rounded after division. No personal PFA factsheet or household statement was collected. Suggested citation: Nigerian Personal Finance, “Nigerian Pension Investments: Map Your Government-Security Exposure,” 10 November 2026. Cite PenCom for the source amounts and this report for the original calculations and private worksheet.


